- December 22, 2022
- Category: Market News
The price line is on a strong resistance
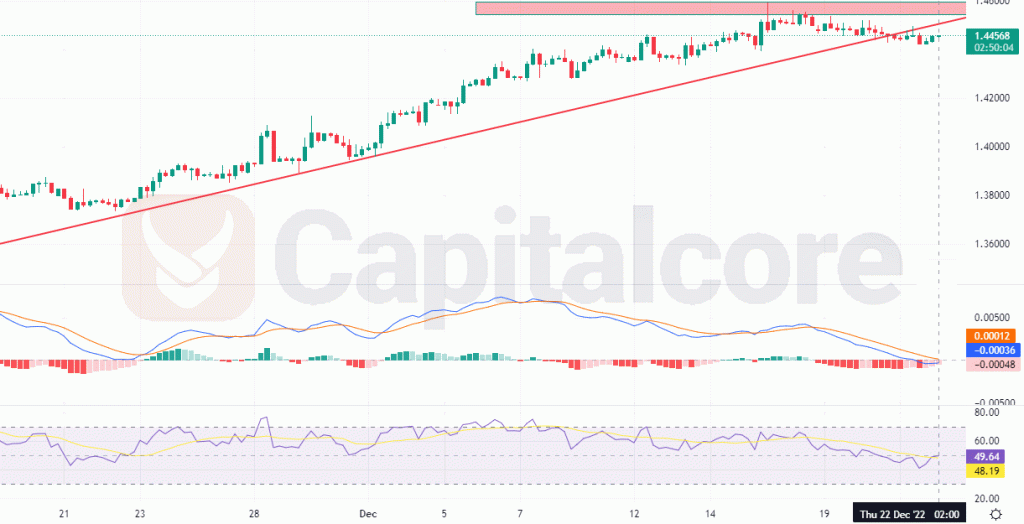
EUR/CAD started moving bullishly on November the fourth 2022; which is still on going on the price chart. The ascending slope of the chart has recently started reducing and some bearish signals are visible on the chart; making the possibility of a bearish wave, high to occur.

Chart Notes:
• Chart time-zone is UTC (+03:00)
• Candles’ time-frame is 4h.
The red ascending line on the chart indicates the dynamic support line which backed up the price line to go through the mentioned ascending wave; and as you can see on the chart, the price line has already broken below this line. MACD histograms have turned light red, but MACD and Signal lines are issuing bearish signal, having a cross over. the red box above the price line indicates a resistance area which has already been able to dump the price line in the recent encounters. Sellers should keep a sharp eye on the chart, waiting to hunt any bearish triggers being pulled, there they can enter short positions heading to 1.42700 and 1.39281 after that. Please note that the validity of this analysis would highly be taken under question, in case the price line breaks above 1.46000.
• DISCLAIMER: Please note that the above analysis is not an investment suggestion by “Capitalcore Ltd”. This post has been published only for educational purposes.