Trend reversal signals have been issued
EUR/CHF has been moving within a descending wave since the April of 2018. The price experienced more than 14% descend until 24th of January 2022. The price then reached out to a strong resistance and is now issuing buy signal. The overall look of the chart is bullish and bulls can be waiting for a trigger to enter long positions .
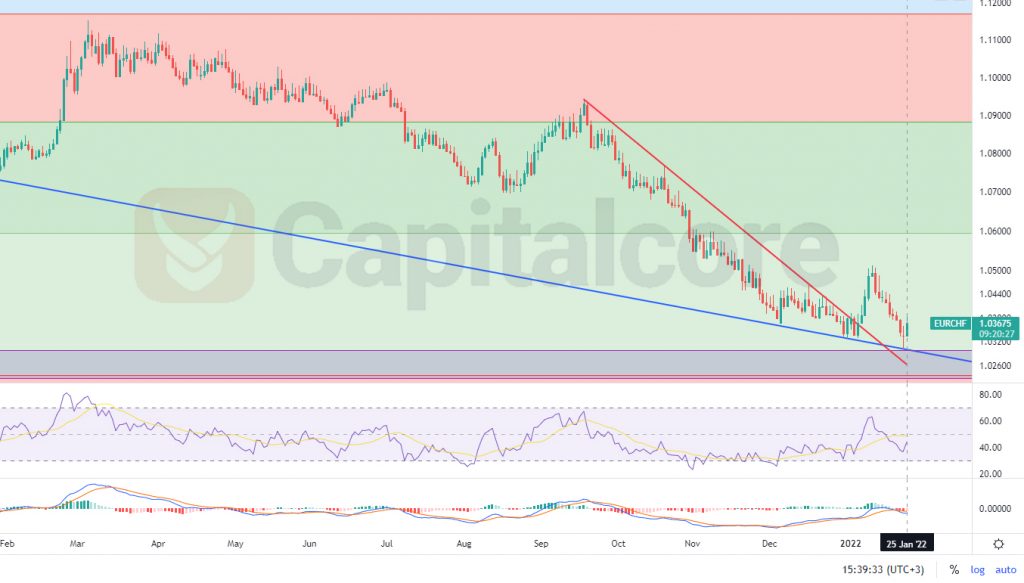
Chart Notes:
• Chart time-zone is UTC (+03:00)
• Candles’ time-frame is daily.
There is a support level on 1.023 – 1.03 which has been able to pump the price several times in the past and also equals to level 0.236 of the Fibonacci level and therefore, is considered a strong support level. There is also a resistance level above the price which has been shown as a red line. The price could break above this dynamic support on 6th of January. At the moment the price is retesting the broken resistance as well as the resistance level which has been shown as a purple zone. RSI is showing positive divergence and MACD is showing weakening of the descending wave. Buyers can be waiting for the price line to fall to the purple area and then they can enter long positions. The target for the ascending wave could be considered on 1.06 and 1.089. Please consider that in case the price line falls below 1.022, the chance for the ascending wave would reduce.
• DISCLAIMER: Please note that the above analysis is not an investment suggestion by “Capitalcore Ltd”. This post has been published only for educational purposes.