The price line is on top of the channel
On EUR/CHF price chart, the price has been moving within a descending channel since 20th of September and has descended more than 5.2 percentages. There has been several reaction made to the top, bottom and mid line of the channel. The price is once more on the top line of the channel and next price move would be of high value.
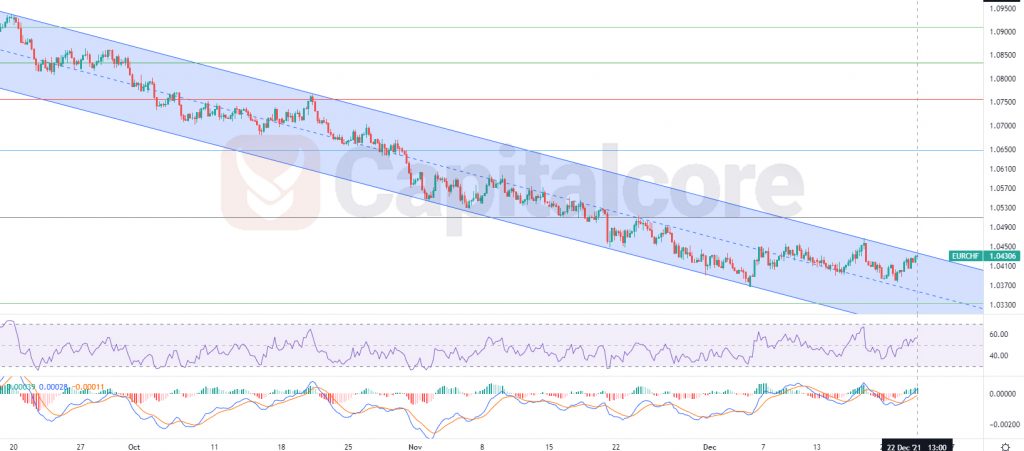
Chart Notes:
• Chart time-zone is UTC (+03:00)
• Candles’ time-frame is 4h.
The price has been moving within the descending line for too long and an out break is highly possible, however the overall look of the chart is still bearish. The price at the moment is on 1.043 and is on the top line of the channel. RSI is almost on 57 and above the midline. MACD is showing a potential up coming bullish wave. In case the price breaks above the top line of the channel, buyers can enter the market on the retest of the channel. The target for the ascending wave could be considered 1.05 and 1.065. On the resistance of the top line of the channel stays valid, sellers can enter the market and target 1.0333 and 1.01115.
• DISCLAIMER: Please note that the above analysis is not an investment suggestion by “Capitalcore Ltd”. This post has been published only for educational purposes.