The price line is on a critical spot
EUR/CHF started an ascending wave on 7th of March 2022, 5 o’clock in the morning. The price line could ascend up to almost 4.3% until 17th of March, at 11 am. The price line, during the ascending wave could break above the resistance level which has been shown asa blue zone on the chart and at the moment, the price is descending to retest this zone.
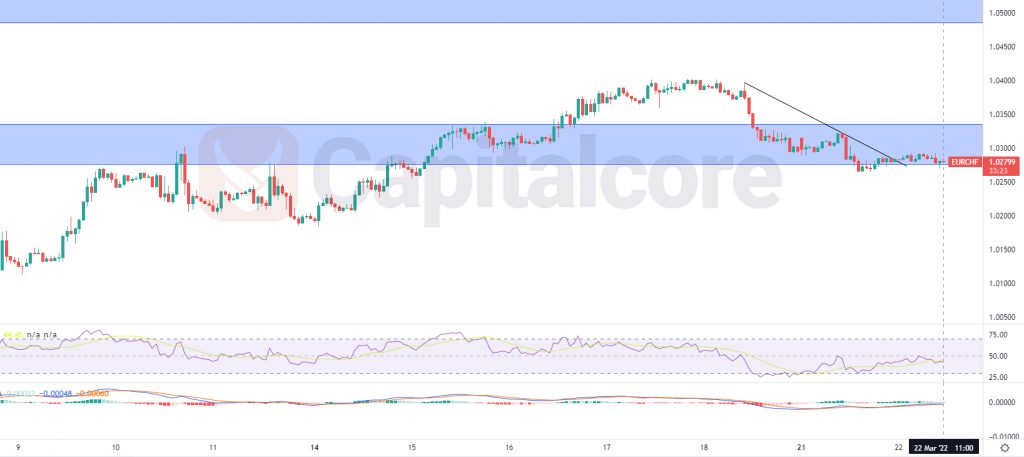
Chart Notes:
• Chart time-zone is UTC (+03:00)
• Candles’ time-frame is 1h.
The price line at the moment is on 1.028, which would be just on the base line of the Blue zone. This zone represents the resistance level which has been recently broken and is expected to act like a support zone. RSI is almost on 45 and is issuing negative divergence. MACD is showing weakness in ascending wave and the possibility of descending is higher. The black line on the chart is showing the bearish trend line which formed the previous descending wave. Traders can be waiting for the price line to break below the blue zone and then they can enter short positions, heading to 1.02 – 10-.016. On the other hand, in case the blue zone can act as a support zone and stops the descending wave, buyers can enter long positions, heading to 4.046 – 1.0534.
• DISCLAIMER: Please note that the above analysis is not an investment suggestion by “Capitalcore Ltd”. This post has been published only for educational purposes.