- August 27, 2024
- Posted By: Ethan Williams
- Category: Market News
Gold Surges to New All-Time Highs: What’s Next?
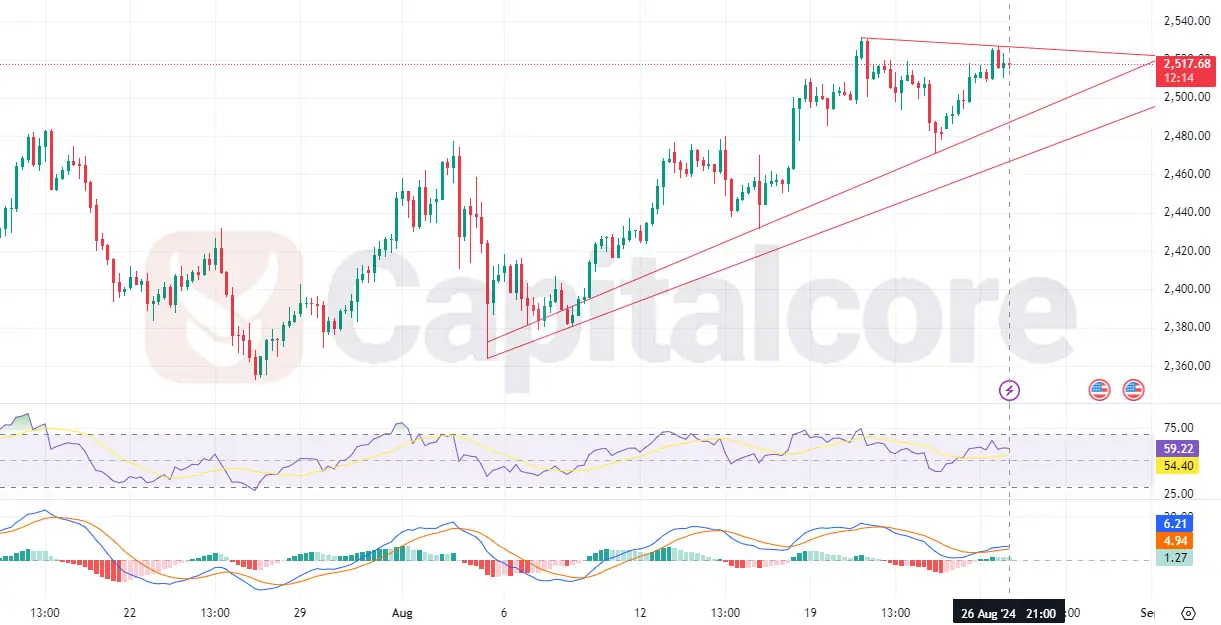
Gold, often referred to by its trading symbol XAU/USD, has recently surged to a new all-time high (ATH), capturing the attention of traders and investors worldwide. The H4 chart reveals an ascending triangle pattern, typically a bullish continuation pattern, suggesting potential for further upward movement. However, the price is currently testing the upper resistance line of this triangle around the $2,517 level, indicating a critical point where the market may decide on its next direction.

Chart Notes:
• Chart time-zone is UTC (+03:00)
• Candles’ time-frame is 4h.
The RSI (Relative Strength Index) is positioned near 59, showing that the market is not yet overbought, providing room for further bullish action. Meanwhile, the MACD (Moving Average Convergence Divergence) histogram is positive, with the MACD line trending above the signal line, both signs of sustained bullish momentum. The upcoming economic data releases today could influence gold’s price action, with traders closely watching for cues that could either confirm a breakout above the current resistance or a potential pullback towards support around the $2,460 level. These movements are crucial for those involved in gold price analysis, prediction, and tracking price action around its recent ATH.
• DISCLAIMER: Please note that the above analysis is not an investment suggestion by “Capitalcore LLC”. This post has been published only for educational purposes.