- January 5, 2022
- Category: Market News
An ascending wave looks to be close
EUR/GBP started a sharp descending wave on 7th of September 2020 and the price on this pair was subject to more than 10% decrease. After this significant decline, the price line reached to a strong support level, where had been able to support the price line and stop ascending wave several times in the past . The area is of high value for this pair and therefore is not expected to be broken.
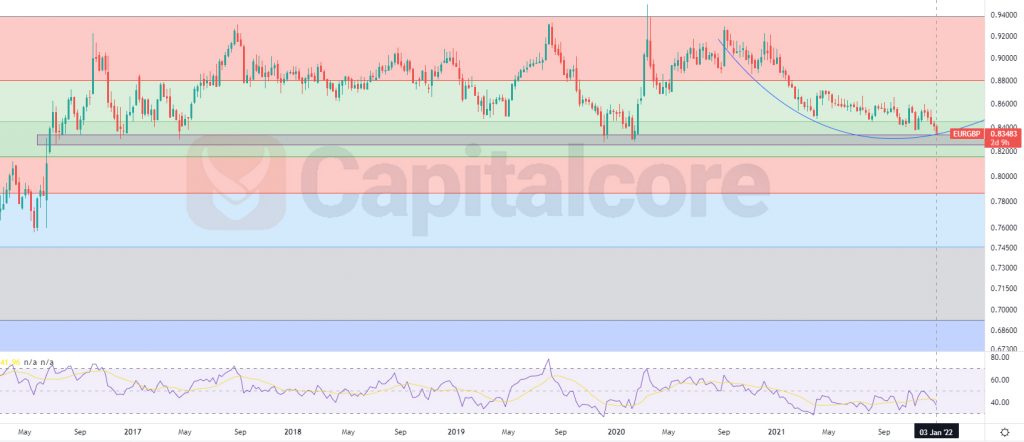
Chart Notes:
• Chart time-zone is UTC (+03:00)
• Candles’ time-frame is weekly.
The resistance area lies on 0.82525 – 0.83388. according to the previous reactions that had been made to this area and regarding the divergence issued by RSI indicator, the price is not expected to fall below the support area. The price at the moment is on 0.83483 which would be just below level 0.382 of the Fibonacci retracement. RSI is on almost 38 and is showing positive divergence. The slope of the descending wave is constantly reducing and the overall look of the chart is bullish. The area between 0.82525 and 0.83388 would be a good price for buyers for opening their positions. 0.88 could be considered the target for the ascending wave; the next target for buyers can be 0.915. Please consider that falling below 0.81275 can highly reduce the chance for an up-coming ascending wave.
• DISCLAIMER: Please note that the above analysis is not an investment suggestion by “Capitalcore Ltd”. This post has been published only for educational purposes.