The support level looks too fragile to hold the price
On EUR/GBP price chart, the price line had been moving on a bullish wave, until 6th of July 2022, when the dynamic support zone below the price line was broken, and the price line went through a sharp descending wave. The bearish rally has caused the price to dump up to 1.88% so far and bulls do not look powerful enough to stop the dump.
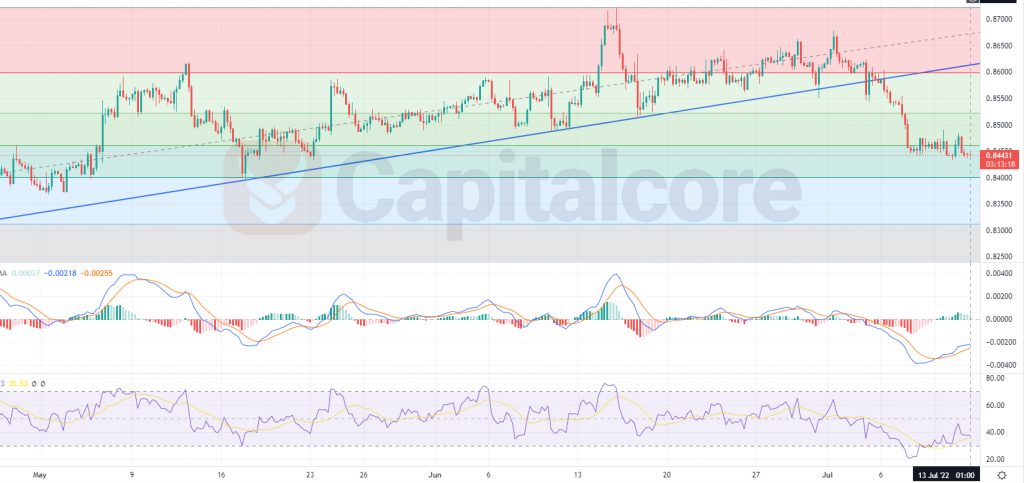
Chart Notes:
• Chart time-zone is UTC (+03:00)
• Candles’ time-frame is 4h.
The price line is indicating 0.84431 at the moment; this area locates just below level 0.5 of the Fibonacci retracement on the previous ascending wave. The blue ascending line on the price chart represents the trend line on the previous wave; as it is visible on the chart, this trend line is already broken and the ascending chance for this pair has largely reduced. RSI is almost indicating 38 and is on a bullish wave, MACD however, is showing weakness on the bulls side. Trades can be waiting for the price line no have a retest of 0.85 and then they can enter short positions. The target for bears can be set on 0.84 and 0.831 after that.
Please consider that, in case the price line breaks above 0.855, the chance would be more with bears than the bulls.
• DISCLAIMER: Please note that the above analysis is not an investment suggestion by “Capitalcore Ltd”. This post has been published only for educational purposes.