Ascending channel is formed
EUR/GBP started a bearish trend since 18th of December 2020 and the price line went through a major loss; the price line finally broke above the descending trend line at 5th of May 2022 and after a correction leg and right now it is potential to continue the bullish phase.
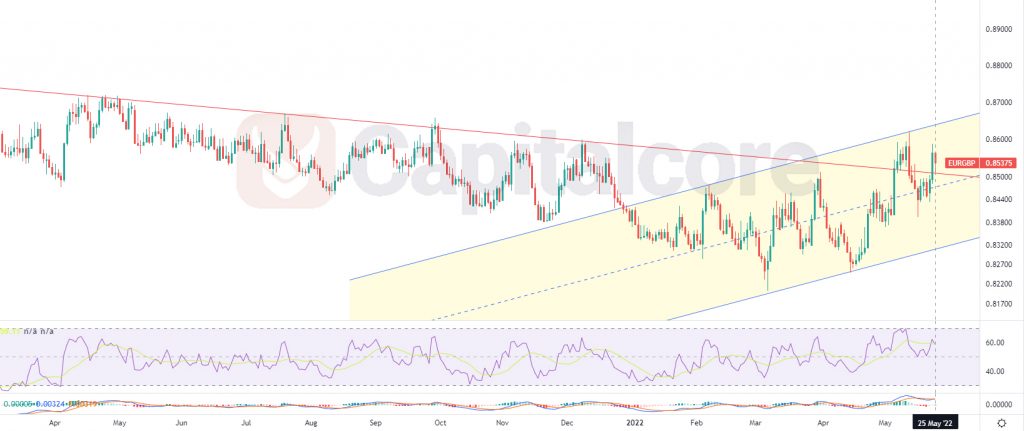
Chart Notes:
• Chart time-zone is UTC (+03:00)
• Candles’ time-frame is daily.
The price line on EUR/GBP is showing 0.85375 at the moment, which would be just above the descending trend line. The trend line is indicated as a descending red line on the chart. The yellow zone on the chart, indicates a bullish channel which has been formed lately and several reactions has been already made to the top, mid and base line of the channel. As you can see, the price is at the moment above the mid line of the channel as well as the bearish trend line. MACD is showing potential for an ascending wave to occur and RSI is almost on 60 and has formed an ascending trend. Traders can be waiting for the price line to have another retest of the broken trend line, then they can enter long positions; below the midline of the channel would be golden entrance for bulls. The targets for the ascending wave could be considered on 0.861 and 883.
Please note that the analysis would lose value if the price line breaks below the base line of the ascending channel.
• DISCLAIMER: Please note that the above analysis is not an investment suggestion by “Capitalcore Ltd”. This post has been published only for educational purposes.