Fibonacci Levels Targeted by Traders
Forex traders often trade EUR/GBP to take advantage of the exchange rate fluctuations between these two currencies. The exchange rate can be influenced by a variety of economic and political factors, such as interest rates, inflation, and geopolitical events. Traders may use various strategies to analyze market trends and make informed decisions about when to buy or sell this currency pair.
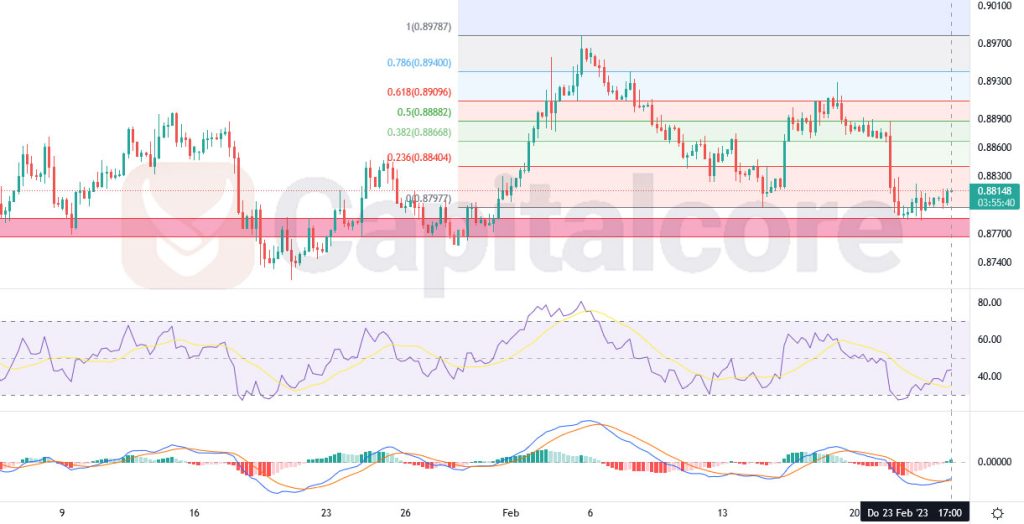
Chart Notes:
• Chart time-zone is UTC (+03:00)
• Candles’ time-frame is 4h.
Over the past few weeks, the EUR/GBP currency pair has experienced a sharp descending wave, but it seems that the price has just started a new bullish phase. This can be observed through a number of technical indicators, such as the MACD histogram turning green and the Relative Strength Index (RSI) showing that the bullish momentum is likely to continue.
Traders who are bullish on EUR/GBP may look to different Fibonacci levels on the previous descending wave as potential targets for buyers. Fibonacci retracements are a popular tool used by traders to identify potential levels of support and resistance on a price chart, based on the assumption that prices tend to retrace a predictable portion of a move before continuing in the original direction.
It is important to note that while technical analysis can provide helpful insights into market trends, it is not always an accurate predictor of future price movements. The forex market is complex and subject to a wide range of economic and geopolitical factors that can impact exchange rates. Traders should always conduct thorough analysis and manage their risks carefully when trading forex.
• DISCLAIMER: Please note that the above analysis is not an investment suggestion by “Capitalcore Ltd”. This post has been published only for educational purposes.