The price line is on a strong support zone
EUR has been loosing power against GBP since 11th of September 2020. After the current dump for EUR due to the Russian military invasion, the price is now on a very strong support line. loosing this area could be followed by a disaster for the currency.
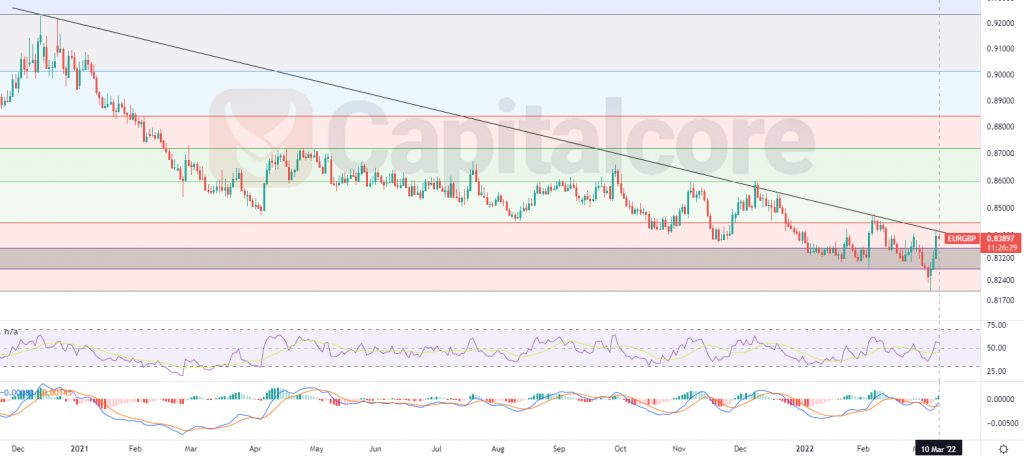
Chart Notes:
• Chart time-zone is UTC (+03:00)
• Candles’ time-frame is daily.
The black line above the price line indicates the trend line within which the price line is descending. The gray box, indicates the support zone which is considered to be very strong. RSI is almost on 55 and is issuing negative divergence. MACD is showing the commencement of a bullish phase. The price line is showing 0.83897, which would be just below the descending trend line. Traders can be waiting for the price line to break above the dynamic resistance zone, as well as level 0.236 of the Fibonacci retracement, which has been shown as a red zone on the chart. In case the price line breaks above this zone, traders can expect to see the price on 0.86 and 0.88, shortly after that.
• DISCLAIMER: Please note that the above analysis is not an investment suggestion by “Capitalcore Ltd”. This post has been published only for educational purposes.