- June 1, 2022
- Category: Market News
A descending wave might occur shortly
EUR/JPY started an ascending wave on 12th of May 2022 and the price increased more than 4.6% until the 1st of June 2022. Along with the ascending wave, a bullish trend line was also formed, right now the price line looks to be approaching a bearish wave and some indicators have issued sell signals.
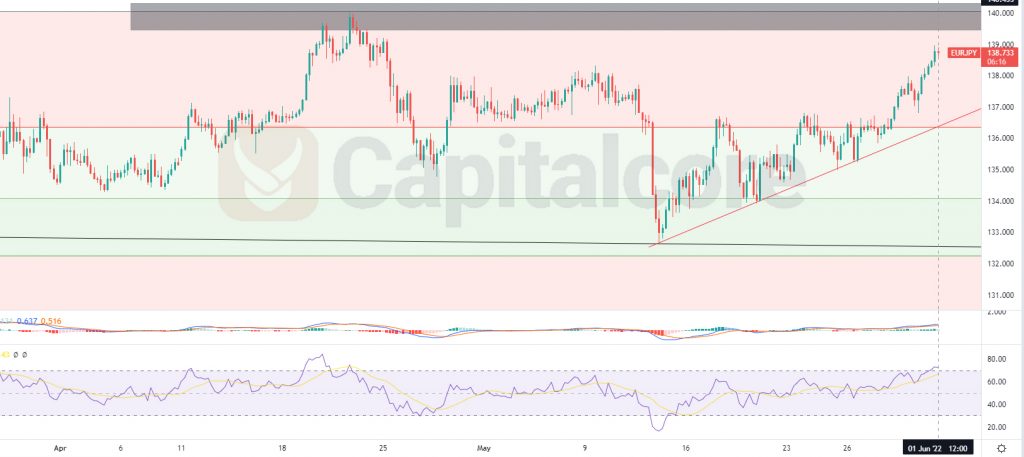
Chart Notes:
• Chart time-zone is UTC (+03:00)
• Candles’ time-frame is 4h.
The price line on EUR/SEK is indicating 138.733 at the moment. The current position of the price line, is located below the static resistance level, which lays at 139.5 – 140.5, and above the dynamic support line which is shown as a red ascending line on the chart. The static resistance is also shown, as a gray zone above the price line. RSI is in over buying area and MACD is showing weakness in ascending trend. The ascending slope of the chart is increasing at an alarming rate and a bearish phase can be expected. Traders can be waiting for the price line to reach out to the gray zone, and then in case the price line broke below the dynamic support, before breaking above the gray zone, then they can enter short positions on the retest of the trend line. The targets for the bears can be considered on 136.37 and 134.36.
Please note that this analysis is valid as long as the price line has not broken above 140.5 .
• DISCLAIMER: Please note that the above analysis is not an investment suggestion by “Capitalcore Ltd”. This post has been published only for educational purposes.