The price line broke below the trend line
The price line started an ascending trend on August 2nd, 2022; within which, the price line successfully ascended to more that 9%, until 12th of September 2022. The price on this pair then started a sharp descending trend and was currently able to break below the trend line and is now completing a retest to this area.
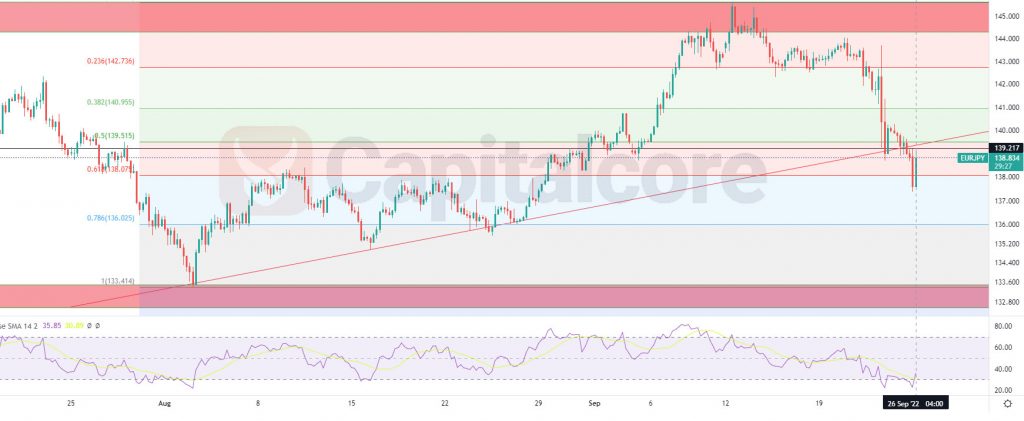
Chart Notes:
• Chart time-zone is UTC (+03:00)
• Candles’ time-frame is 4h.
The price line on EUR/JPY is currently showing 138.834, where is located below the bullish trend line. The bullish trend line is reflected as an ascending red line on the chart. the black horizontal line is indicating an important resistance, as it has been able to dump the price line several times in the past. The red level on the chart indicates level 0.618 of the Fibonacci retracement the previous ascending wave. As it is shown on the chart, the price line is completing retest of this area. RSI, however has issued a negative divergence signal. Sellers can be waiting for ant bearish triggers on shorter time frame; there they can enter short positions heading to the lower Fibonacci levels at 136.124 and 133.012 . Also consider that the validity of this analysis would reduce significantly, in case the price line breaks above the ascending trend line.
• DISCLAIMER: Please note that the above analysis is not an investment suggestion by “Capitalcore Ltd”. This post has been published only for educational purposes.