The price is keeping everyone on their toes
This pair has formed a bearish structure which needs to be paid more attention. This structure could be the sign of a trend reversal. In this case the pattern would be followed by a larger bearish step. On the other hand it could be just a small correction phase, which will be followed by a ascending step.
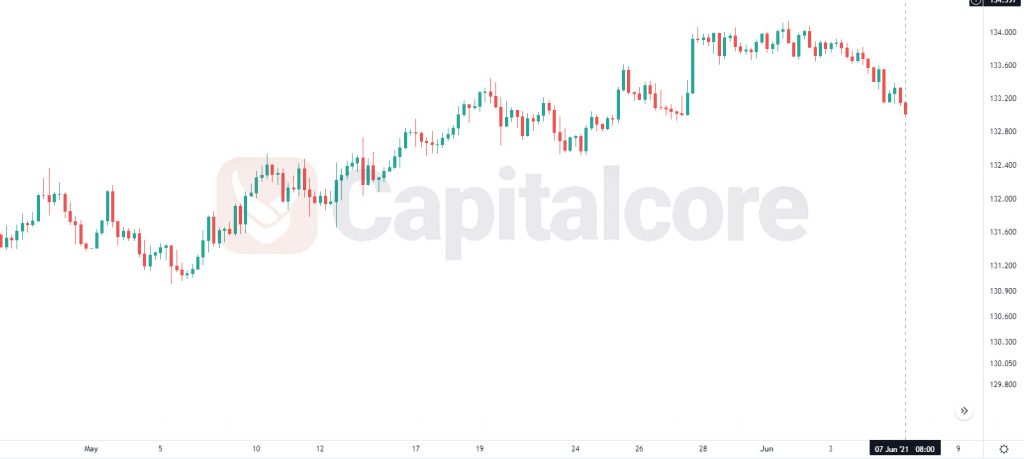
Chart Notes:
• Chart time-zone is UTC (+03:00)
• Candles’ time-frame is 4h.
The support rests at 133.07 with resistance at 133.28 which the Pivot Point at 133.20 is located above the price line. Also, the price is moving in the first support area. The EMA of 10 is moving in bearish bias in descendant channel and it is above EMA of 200 and the EMA of 100 which are showing a bullish trend. The RSI is moving in oversold area, the MACD histogram is in negative territory. The Stochastic is moving in low ranges and the ADX is showing an upward momentum. The price is below the Ichimoku Cloud and the Chinkou Span far away the market price. The Tenkan-sen and the Kijun-sen both are showing a downward momentum.
• There is resistance at 133.28, followed by resistance at 133.41 and 133.49.
• There is support at 133.07 Below, there is 132.99 and 132.86.
• DISCLAIMER: Please note that the above analysis is not an investment suggestion by “Capitalcore Ltd”. This post has been published only for educational purposes.