- November 4, 2021
- Category: Market News
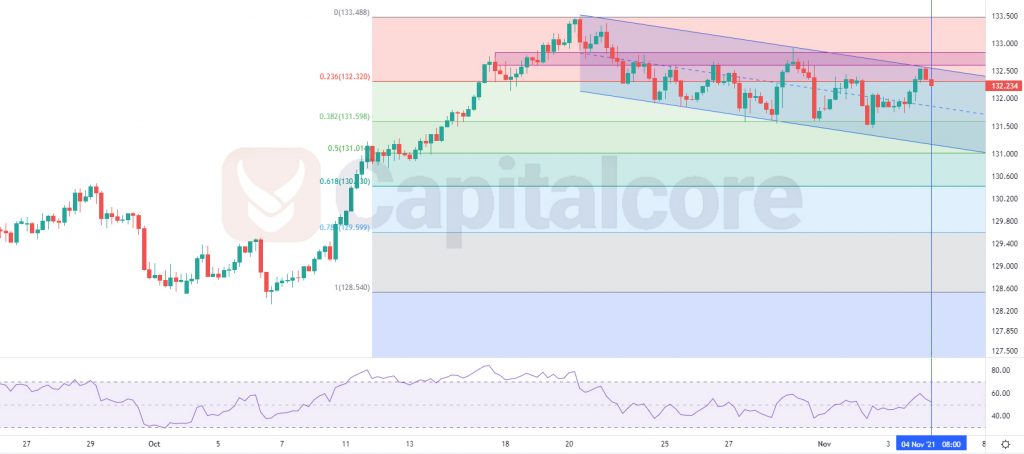
The price is on the top of the channel.
The price has had a sharp ascend and then started to form a descending channel. The price line has reacted to the top, bottom and mid line of the channel several times. The channel is still valid and has not been broken to either sides. The overall look of the chart is bearish.

Chart Notes:
• Chart time-zone is UTC (+03:00)
• Candles’ time-frame is 4h.
There is a static resistance on 135.6 / 132.85. The resistance looks too strong to be broken. A bearish phase is expected at least to the mid line of the channel. Sellers can target 131.6 as their first TP and if the descend is powerful enough, the next target can be set on 131. On the other hand, in case the price line breaks above the resistance on 132.85, buyers can enter the market. The targets for the ascending wave could be set on 133.45 and 134.
• DISCLAIMER: Please note that the above analysis is not an investment suggestion by “Capitalcore Ltd”. This post has been published only for educational purposes.