The ascending channel is still valid
The positive momentum is seen on the EURJPY chart but we need to pay attention to the next breakout. So, despite the bullish look, a bearish breakout may happen. The ascending channel has not been penetrated yet and the bullish step is technically still on going. the overall look of the chart is still bullish.
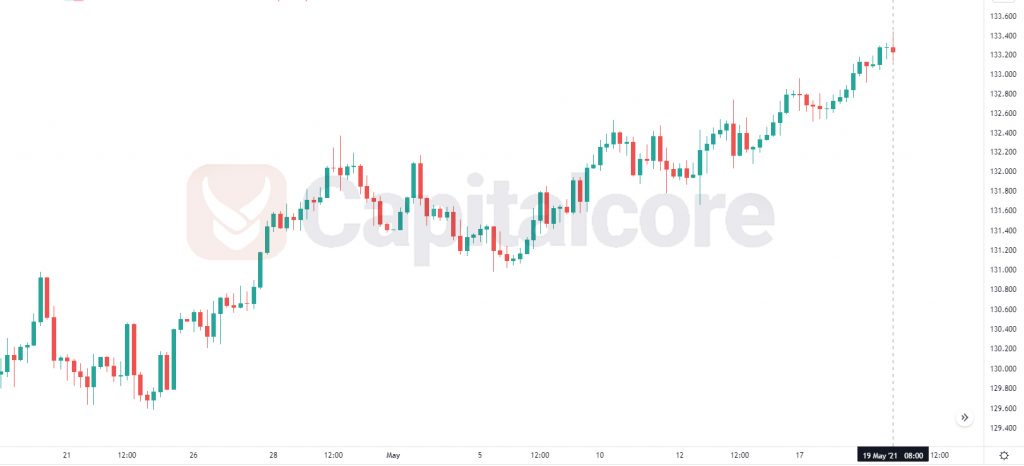
Chart Notes:
• Chart time-zone is UTC (+03:00)
• Candles’ time-frame is 4h.
The support rests at 133.12 with resistance at 133.36 which the Pivot Point at 133.21 is located below the price line. Also, the price touched the first residence level. The EMA of 10 is moving in bullish bias in ascendant channel and it is above EMA of 200 and below the EMA of 100 which are showing a bullish trend. The RSI is moving in overbought area, the MACD histogram is in positive territory and is showing a buy signal. The Stochastic is moving in high ranges and the ADX is showing an upward momentum. The price is above the Ichimoku Cloud and the Chinkou Span far away the market price. The Tenkan-sen and the Kijun-sen both are showing an upward momentum.
• There is resistance at 133.36, followed by resistance at 133.45 and 133.60.
• There is support at 133.12 Below, there is 132.97 and 132.88.
• DISCLAIMER: Please note that the above analysis is not an investment suggestion by “Capitalcore Ltd”. This post has been published only for educational purposes.