- February 23, 2022
- Category: Market News
sideway range is about to end
Due to the Ukraine conflict and possible upcoming consequences, EUR price is potential of undergoing a descending phase. Technically, the chart is losing bullish power after reaching out to a dynamic support line and sellers can be waiting for a bearish signal to enter short positions.
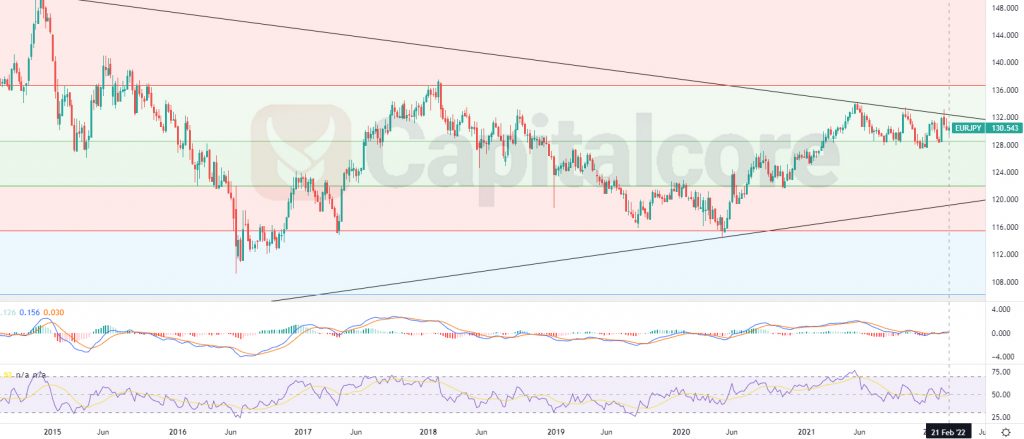
Chart Notes:
• Candles’ time-frame is weekly.
On EUR/JPY price chart, the price at the moment is on 130.543 which would be just below the dynamic resistance and just above level 0.382 of the Fibonacci retracement. The black line above the price shows the dynamic resistance and the one below the price line, indicates the dynamic resistance. RSI is on 52 and MACD is showing a weak ascending phase on going. In case the price line breaks below level 0.382 of the Fibonacci retracement, traders can be waiting for a retest of the level and then they can enter short positions heading to 122.2; the other TP can be set on 116.51. Please consider that in case the price line breaks above the dynamic resistance, the possibility for an ascending wave would highly reduce.
• DISCLAIMER: Please note that the above analysis is not an investment suggestion by “Capitalcore Ltd”. This post has been published only for educational purposes.