Everything is ready for an ascend
EUR/JPY has been ascending above an ascending trend line and recently after a descending wave the price is on an important area; the dynamic support line is below the price and level 0.786 of the Fibonacci retracement stays above the price line acting as a resistance level. The overall look of the chart is bullish.
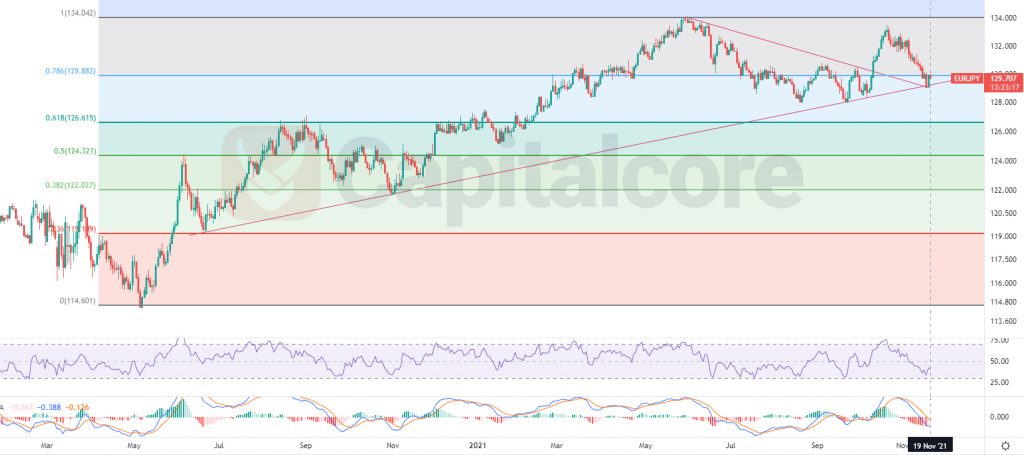
Chart Notes:
• Chart time-zone is UTC (+03:00)
• Candles’ time-frame is daily.
The pink line below the price line indicates the strong dynamic support that started forming on January 20th, 2020. The line has been able to pump the price several times in the past and therefore is considered a strong support level. The price line has been able to break above a descending trend line and has also made a pull back. The RSI is showing positive divergence and MACD is showing weakness in the descending leg. The price line is just below level 0.786 of the Fibonacci retracement. In case the price line breaks above the Fibonacci level, bulls can be expending to see the price on the next Fibo level on 134. Please consider that breaking below the support level will decrease the chance of an ascending wave.
• DISCLAIMER: Please note that the above analysis is not an investment suggestion by “Capitalcore Ltd”. This post has been published only for educational purposes.