- January 19, 2023
- Category: Market News
A trend reversal looks to be close
EUR/CAD price line started moving within a side way range at December 7th, oscillating between a static support and a static resistance level. The previous bullish leg started at January the 5th 2023 and could pump the price line up, more than 2.43%. The price line is now on an important level and the next move could a highly profitable for the traders.
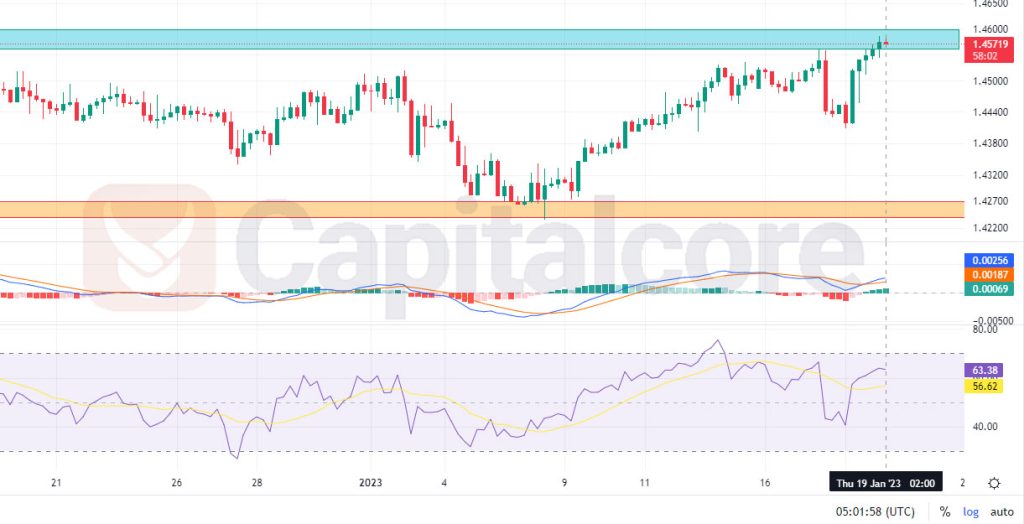
Chart Notes:
• Chart time-zone is UTC (+03:00)
• Candles’ time-frame is 4h.
The price line is currently on 1.45719, that would be just inside the resistance level at 1.45635 – 1.46000. This supply level is of high importance, as it has already been able to pump the price line several times in the past; and is indicated as a sky-blue box just above the price line. The current ascending leg is also looking to be weakening and the candle patterns are also showing strong possibility for an upcoming bearish leg. The orange zone below the price line reflects an important static support zone that could be considered as the final target for the upcoming bearish leg. RSI has issued a very strong negative divergence signal, yet MACD is still showing a bullish phase is still on going. Sellers should keep a sharp eye on the chart to hunt any bearish trigger being ignited, there they can enter short positions heading to the resistance levels at 1.44100 and 0.42500.
• DISCLAIMER: Please note that the above analysis is not an investment suggestion by “Capitalcore Ltd”. This post has been published only for educational purposes.