An ascending wave might occur shortly
EUR/JPY had gone through a ranged market for the last year and the price bounced between a support and a resistance level, until 10th of February 2022, when a sharp descending wave occurred, followed by another sharp bullish wave.
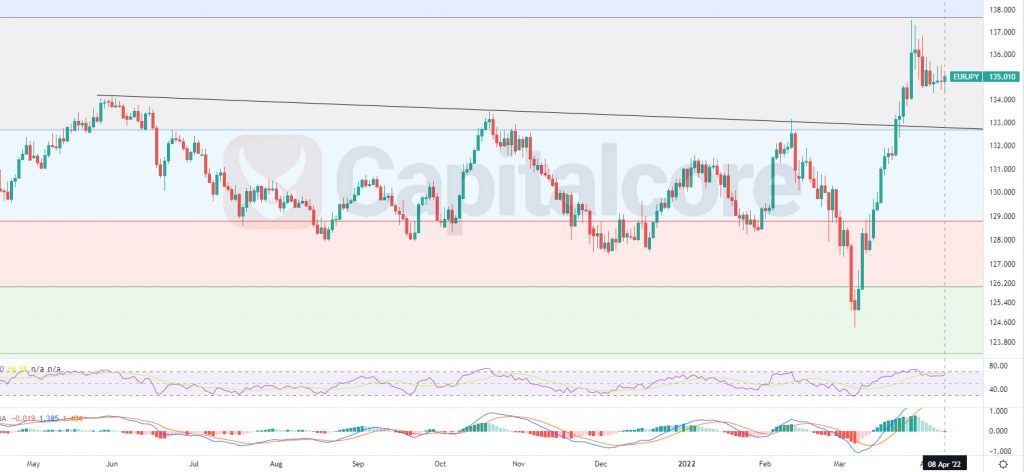
Chart Notes:
• Chart time-zone is UTC (+03:00)
• Candles’ time-frame is daily.
The price line on EUR/JPY is currently showing 135.01 which would be just above level 0.786 of the Fibonacci retracement on the previous major descending wave, as well as the broken dynamic resistance. The black line on the chart indicates the resistance level that we mentioned above and the line between the blue and the gray zone indicates the Fibonacci level. RSI at the moment is indicating almost 64 and MACD is showing weakness in the ascending trend. Traders can be waiting for the price line to have a retest of the broken resistance, there they can enter long positions and target 137.7, 145 and 152 as the possible goals for the ascending wave.
Please note that the above theory would be on validity as long as the price line has not broken below the resistance level.
• DISCLAIMER: Please note that the above analysis is not an investment suggestion by “Capitalcore Ltd”. This post has been published only for educational purposes.