The price is once more on the resistance level
EUR/JPY started an uptrend on 19th of June 2020. The uptrend continued till first of Jun 2021. Since then a correction phase started and the price line felt to level 0.618 of the Fibonacci retracement; this area has been able to stop the bearish wave several times and now once more the price line is almost on this area.
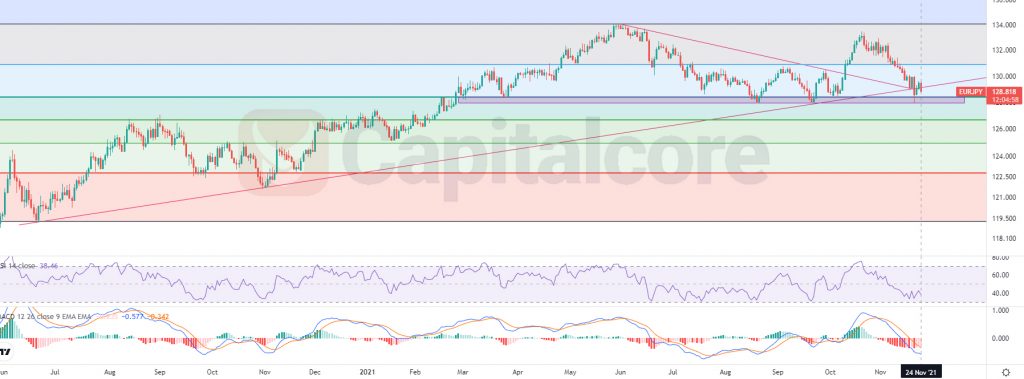
Chart Notes:
• Chart time-zone is UTC (+03:00)
• Candles’ time-frame is daily.
EUR/JPY price is on 128.818 at the moment which is pretty close to the support level at 127.96 – 128.4. The area is of high value for the pair as it equals to 0.618 of the Fibonacci retracement and has pumped the price several times in the past. Losing this area would be followed by a large loss for the pair. RSI right now is indicating almost 40 and MACD suggests that the descending wave is about to end. Buyers can be waiting for the price to break above the dynamic support line in pink and then can target 130.937 as their first TP and 132.3 as the next one. Please note that breaking below 127.96 would largely reduce the chance of ascend.
• DISCLAIMER: Please note that the above analysis is not an investment suggestion by “Capitalcore Ltd”. This post has been published only for educational purposes.