Mid line of the channel is supporting
EUR/NOK has been moving within a descending channel since early June 2020. The price has made several reactions to the top, mid and base line of the channel; the channel is still valid as the price line has not been able to break out of it. The price line is now once more reacting to the midline of the channel; traders can be waiting for a good trading opportunity.
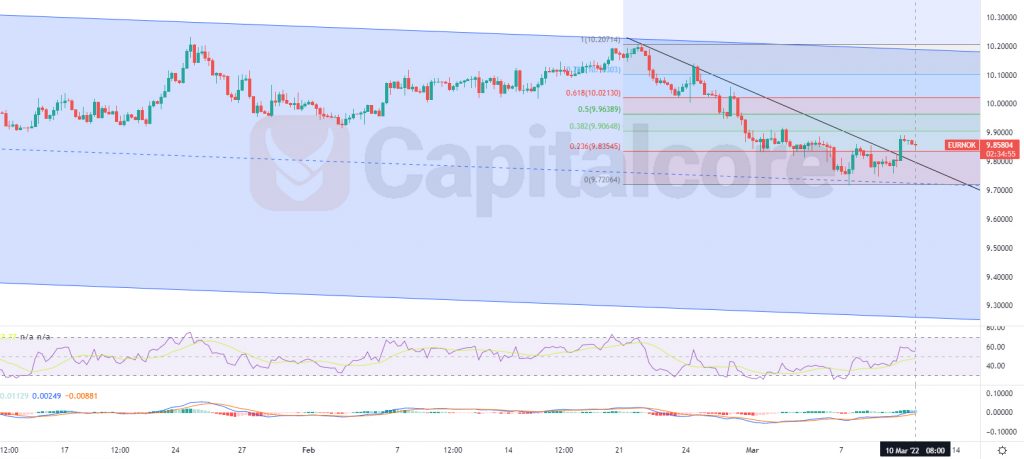
Chart Notes:
• Chart time-zone is UTC (+03:00)
• Candles’ time-frame is 4h.
On EUR/NOK price chart, the price line is indicating 9.858 at the moment. The sky blue zone shows the descending channel range. As you can see on the chart, the price line is approaching to the mid line of the channel and it is making some reactions to this area. The black line above the price line is indicating a short term descending trend line, which has recently been broken by the price line. RSI is showing almost 55 and is on a bullish trend. MACD is showing weakness in ascending phase. Traders can be waiting for the price line to have a retest of level 0.236 of the Fibonacci retracement on 9.83 – 9.84 ; there, buyers can enter the market, in case of witnessing any bullish signals. The targets for the ascending wave could be considered on 9.9 , 9.96 and 10.07. Keep in mind that forming a lower low on the chart, would reduce the bullish power majorly.
• DISCLAIMER: Please note that the above analysis is not an investment suggestion by “Capitalcore Ltd”. This post has been published only for educational purposes.