Bearish Trend Expected
EUR/NOK has been exhibiting a bullish trend as indicated by the price line going through a bullish channel. However, the price is currently facing a static resistance level. This suggests that buyers are finding it difficult to push the price higher and the bears may be gaining some control over the market.
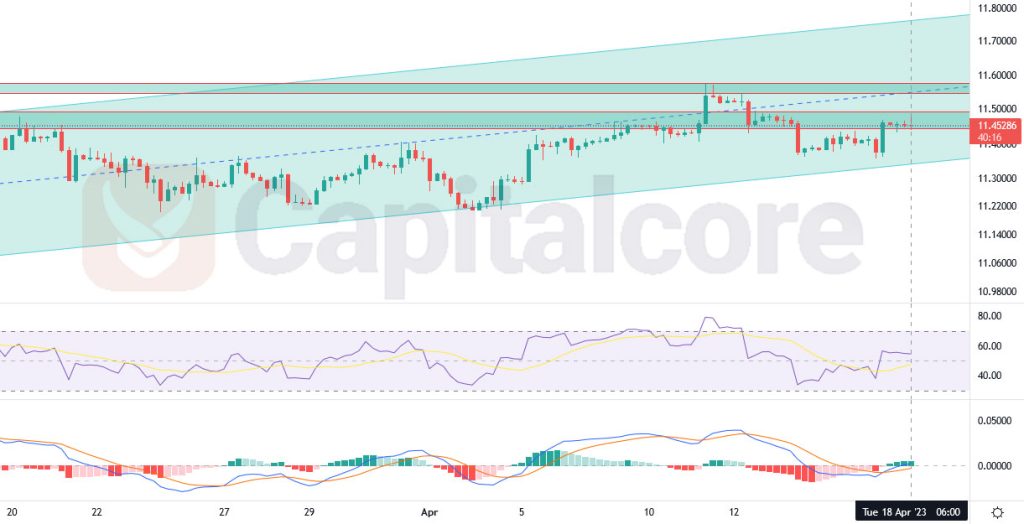
Chart Notes:
• Chart time-zone is UTC (+03:00)
• Candles’ time-frame is 4h.
The Relative Strength Index (RSI) has entered a bearish wave, which is also an indication that the bears are gaining momentum. When the RSI enters the bearish zone, it indicates that the sellers are taking control and that the price may decline. In addition, the MACD and SIGNAL line are reacting to the MACD histograms, which is another indication that a bearish wave could be expected. When the MACD and SIGNAL line cross below the zero line, it indicates a bearish momentum. This is because it suggests that the bears are gaining control over the market.
Overall, based on the analysis of the EUR/NOK price, it appears that a bearish trend may be expected in the near future. However, it’s important to note that no analysis is 100% accurate and there are always other factors that could impact the price of the currency pair. Therefore, traders should always use caution and conduct their own analysis before making any trading decisions.
• DISCLAIMER: Please note that the above analysis is not an investment suggestion by “Capitalcore Ltd”. This post has been published only for educational purposes.