Bullish market, as good as gone
In EUR/NZD price chart, the price line had been moving above a dynamic support since April of 2015. on 14th of October 2021, the price line could finally break below this support level and then continued the ascending wave and could reach out to almost 1.606 on 18th of November 2022. The price line then had a smooth ascend and right now is touching the broken support once more.
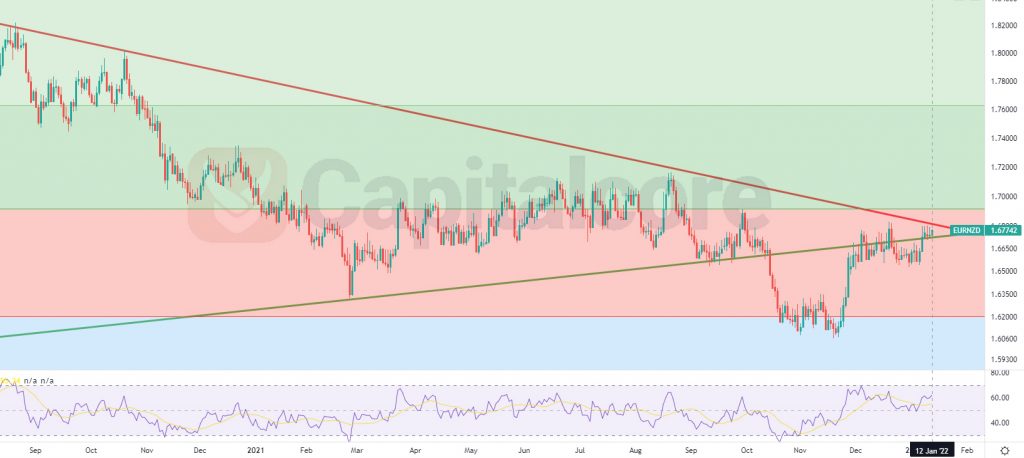
Chart Notes:
• Chart time-zone is UTC (+03:00)
• Candles’ time-frame is daily.
The red line on the chart, indicates a dynamic resistance which started forming on First of April 2021 and led the price line through an ascending wave. The green line, indicates the strong dynamic support which started forming on 20th of April 2015. The price at the moment is on 1.67742 and is touching the broken support as well as the dynamic resistance. RSI is on, almost 63 and is showing negative divergence comparing to the price line. To come back to the ascending phase, the price line needs to break above the resistance, the broken support which is expected to act as a resistance and also level 0.5 of the Fibonacci retracement. Ascending phase is therefore more expected. Sellers can enter the market and set their target points on 1.5905 and 1.5191. Please consider that in case the price rises above level 0.5 of the Fibonacci retracement, which would be on 1.693, A bullish market would be expected.
• DISCLAIMER: Please note that the above analysis is not an investment suggestion by “Capitalcore Ltd”. This post has been published only for educational purposes.