Price line on the most important resistance
EUR/NZD price is trying to recover the previous dump. The price line has made several attempts to recover but each time the dynamic resistance, shown in pink in the following picture, has stopped the growth. At the moment the price line is once more touching the line.
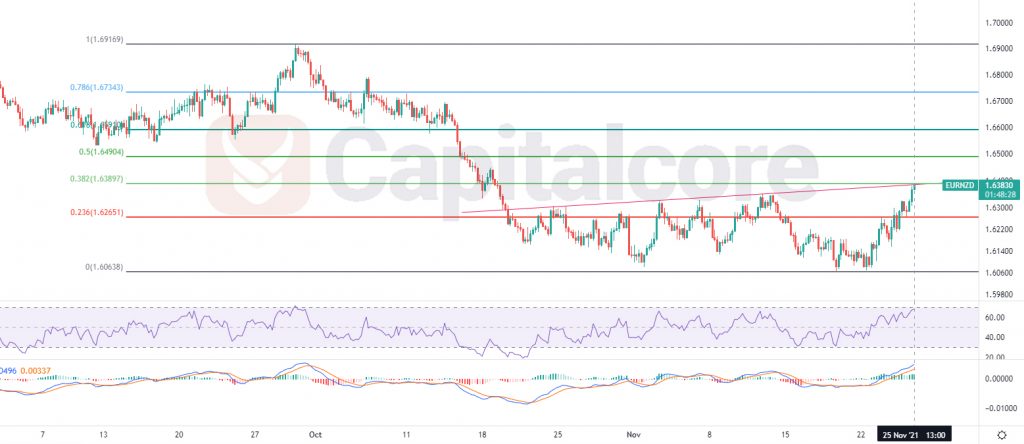
Chart Notes:
• Chart time-zone is UTC (+03:00)
• Candles’ time-frame is 4h.
The price at the moment is touching level 0.382 of the Fibonacci retracement as well as the dynamic resistance. The closest support level lays on 1.6267 which equals to level 0.236 of the Fibonacci retracement. RSI is showing almost 69 and MACD is showing strong bullish power. In case the resistance level stops the growth once more, the price line could fall to the 0.236 of the Fibonacci retracement; if the descend exceeds that area, the next TP for sellers can be 1.6088. On the other hand, if the price line breaks above 0.382 buyers can target the next level of the Fibonacci retracement on 1.6492. the next TP for buyers can be considered 1.6592. Please consider that pull back on the broken resistance or support levels is highly possible.
• DISCLAIMER: Please note that the above analysis is not an investment suggestion by “Capitalcore Ltd”. This post has been published only for educational purposes.