- March 16, 2022
- Category: Market News
Another sharp move might occur soon
EUR/PLN started a sharp ascending wave on 16th of February 2022 and could ascend more than 11.5% until 7th of March 2022 and then started a descending wave and formed a descending trend line. The price line has just reached out to level 0.618 of the Fibonacci retracement.
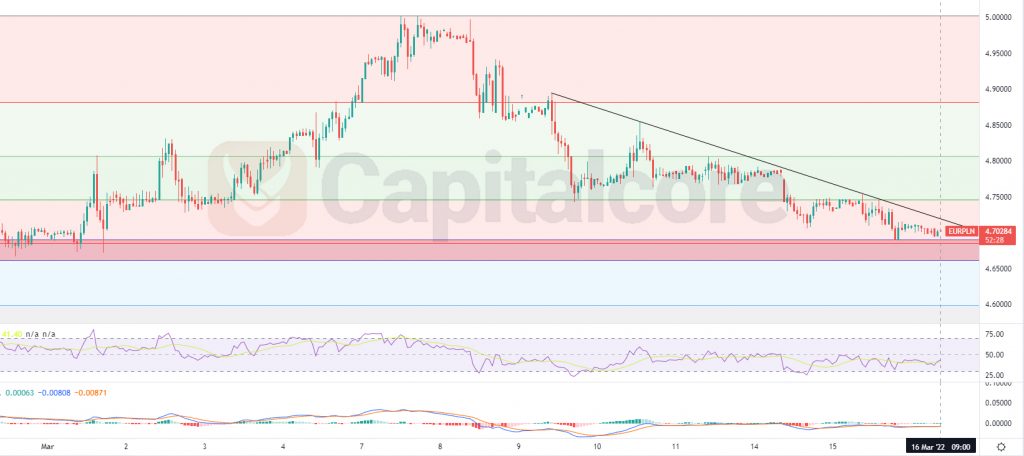
Chart Notes:
• Chart time-zone is UTC (+03:00)
• Candles’ time-frame is 1h.
At the moment, the price line is approaching level 0.618 of the Fibonacci retracement and the support zone which has been shown as a pink zone. The black descending line on the chart indicates the trend line that was formed on the current descending wave. RSI is almost on 43 and is issuing positive divergence. MACD is showing uncertainty among traders and therefore a sharp leg is potential of taking place shortly. Traders can be waiting for the price line to break above the dynamic resistance or break below the support zone on level 0.618 of the Fibonacci retracement. in case the bulls take over the market, possible targets for the ascending wave could be considered on 4.8 and 4.842 . On the other hand, if Bears overtake the market, the possible target for the descending wave could be considered on 4.616 and 4.528 .
• DISCLAIMER: Please note that the above analysis is not an investment suggestion by “Capitalcore Ltd”. This post has been published only for educational purposes.