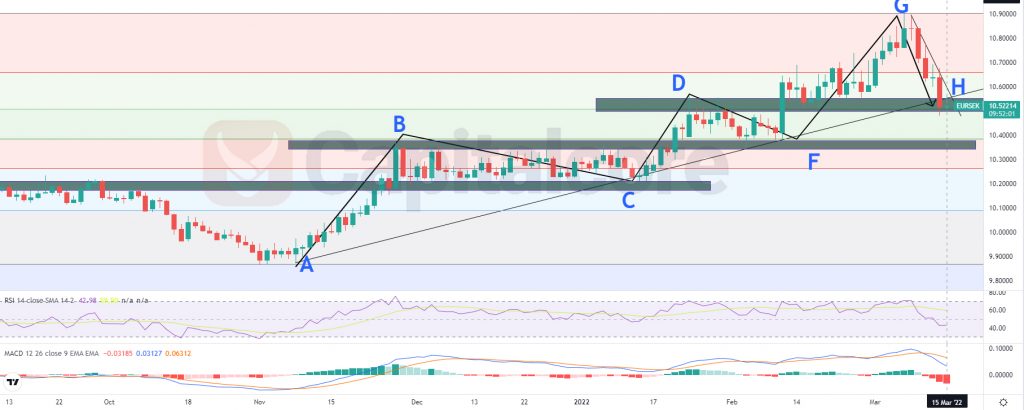
The ascending wave is still on going
EUR/SEK, started and ascending wave on 8th of November 2021 and could ascend up to 10.4% until 7th of March 2022. The price line then descended more than 3.8% and right now the price line is on the ascending trend line. There a high chance of anther ascending wave to occur shortly.

Chart Notes:
• Chart time-zone is UTC (+03:00)
• Candles’ time-frame is daily.
The price line at the moment is showing 10.52214. The black ascending line, shows the dynamic trend line which has formed the current bullish wave. As it is shown on the chart, by the beginning of this ascending trend, the price line experienced an ascending leg, from point A to B. The price line then descended to the trend line, it could be said that the correction phase, reached out to the climax of the previous ascending wave.
This phenomenon took place again on 13th of January 2022 (point C); There the price line ascended to point D on 24th of January 2022 and then a descending leg dumped the price to the previous climax again. At the moment, the price line, after dumping from level G to H, which equals to the climax of the previous ascending wave.
RSI at the moment is showing almost 42 and MACD is showing strong descending wave on going. Traders can be waiting for the price line to break below or above the dark box on the chart, then they can enter position on the same direction with the price line. The target for the descending wave could be considered on the dark, on F; On the other hand, if the price line breaks above the zone, the target can be considered on 10.7 and also 10.89495.
• DISCLAIMER: Please note that the above analysis is not an investment suggestion by “Capitalcore Ltd”. This post has been published only for educational purposes.