A sharp wave is about to occur
EUR/SEK started a sharp descending wave on 8th of March 2022, as a result of which, the price on this pair descended up to almost 6.25% until 20th of April 2022; and then another ascending wave occurred. This ascending wave is still on going but as it seems, bullish power has decreased and a sharp descending wave is potential to occur.
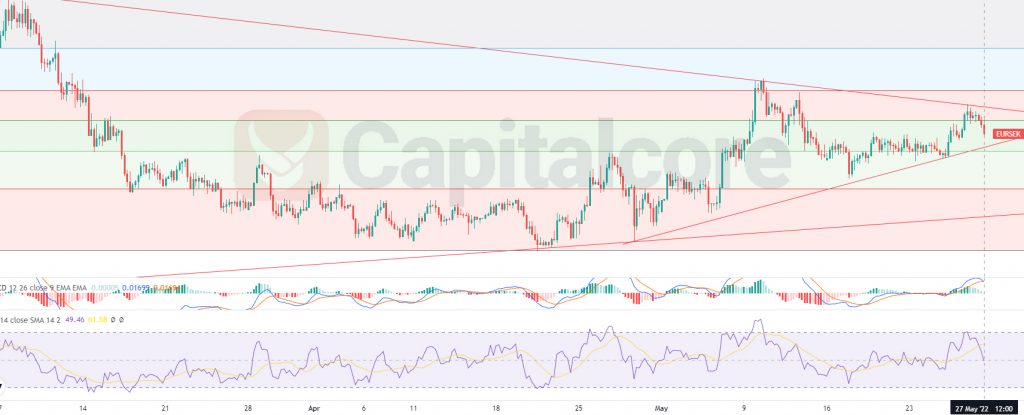
Chart Notes:
• Chart time-zone is UTC (+03:00)
• Candles’ time-frame is 4h.
The price line on EUR/SEK is almost on 10.54 at the moment. The red line which is placed just below the price line, indicates the trend line which has formed the current ascending leg. The other red line which lies below the price line by a distance indicates the other trend line which has formed a bigger ascending wave on daily timeframe. RSI is almost on 50 and is also on a support level and MACD is indicating the commencement of a descending wave. Traders can be waiting for the price line to break below the short term trend line, and then they can enter short positions heading to 10.385 which would be on level 0.236 of the Fibonacci retracement on the previous descending wave, the other target for the up-coming wave could be considered on 10.27. Traders with bigger risk appetite can enter the position as soon as the RSI breaks below the ascending trend line.
Please note that this analysis would be of value as long as the price line has not broken above the dynamic resistance above, which has been indicated as a red descending line.
• DISCLAIMER: Please note that the above analysis is not an investment suggestion by “Capitalcore Ltd”. This post has been published only for educational purposes.