Forecasting EUR/USD: Clash of Indicators
The EUR/USD is at a crossroads with conflicting signals: a looming red Ichimoku Cloud points to potential bearishness, while strengthening green MACD bars suggest growing bullish momentum. Traders should tread carefully, given these mixed indications.
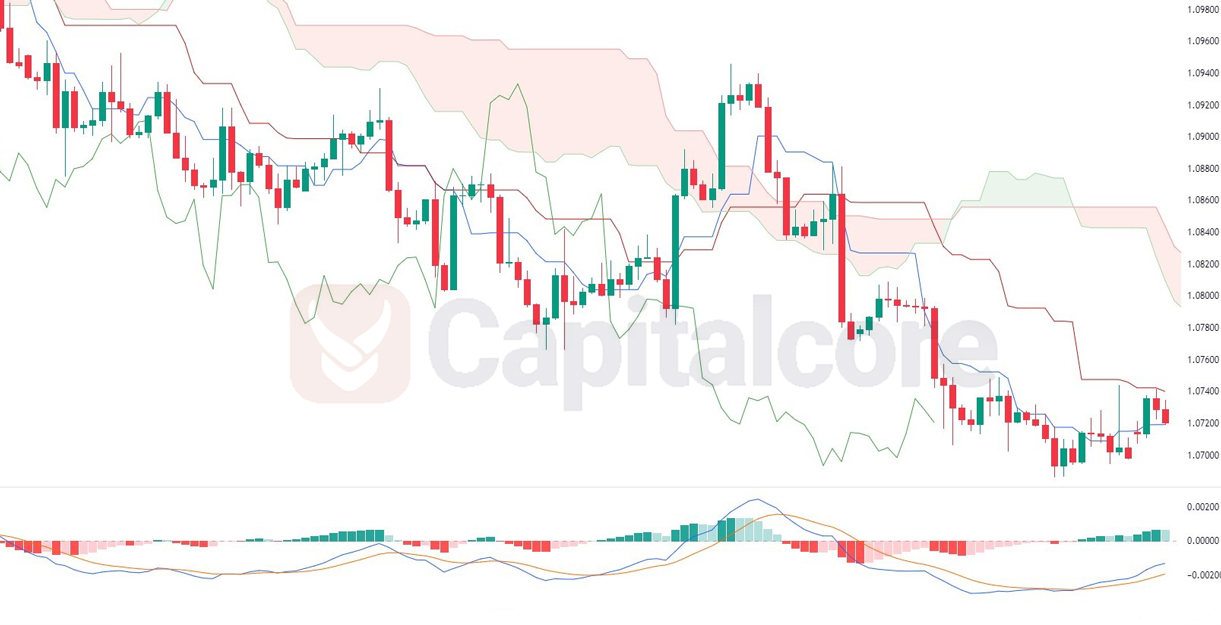
Chart Notes:
• Chart time-zone is UTC (+03:00)
• Candles’ time-frame is 4h.
The EUR/USD pair currently displays bearish signs in the context of the Ichimoku Cloud. A red cloud ahead suggests potential resistance and is an indication that the pair might face downward pressure in the near future. Concurrently, the MACD (Moving Average Convergence Divergence) bars turning greener and growing in strength indicates a strengthening bullish momentum. This might seem contradictory at first, but it’s not uncommon for different indicators to provide differing signals. Traders should approach with caution, considering both these signals. It’s possible we might witness a tug-of-war between the bulls and bears in the coming sessions. Monitoring price action closely, especially around the cloud, will be crucial for determining the pair’s next direction
• DISCLAIMER: Please note that the above analysis is not an investment suggestion by “Capitalcore Ltd”. This post has been published only for educational purposes.