- Posted By: capadmin
- Category: Market News
Green Signals for EUR/USD
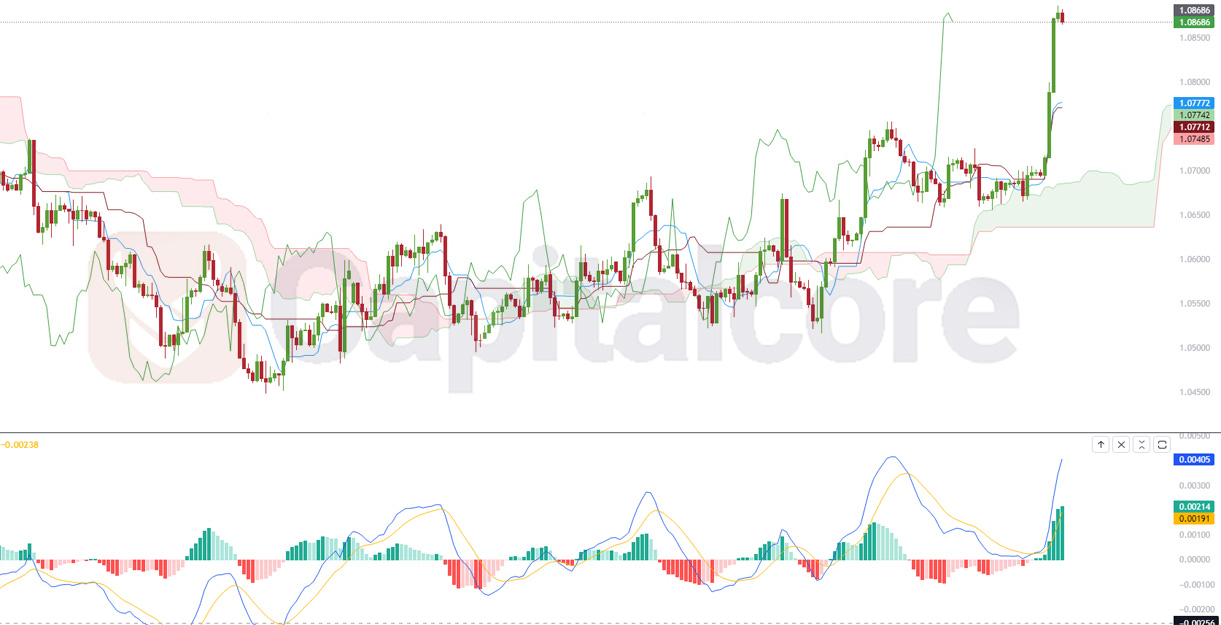
In the MT4 chart for EUR/USD, the MACD indicator signals a potentially bullish trend. The recent histogram bars have turned green, indicating a strengthening of bullish momentum. Moreover, the MACD line is positioned above the green bars and is cutting through the signal line in an upward direction, which is seen as a bullish crossover. These MACD configurations suggest increasing upward pressure on the currency pair.

Chart Notes:
• Chart time-zone is UTC (+03:00)
• Candles’ time-frame is 4h.
In the Ichimoku analysis of EUR/USD, the latest cloud formation is green, signifying a potential shift towards a bullish bias. The candlesticks are positioned above the green cloud, suggesting a favorable market sentiment. Additionally, the conversion line is situated below the candlesticks, reinforcing the bullish outlook. Collectively, these Ichimoku indicators indicate a potential upward trend in the EUR/USD pair. Traders may consider these signals as they make their trading decisions in this context.
• DISCLAIMER: Please note that the above analysis is not an investment suggestion by “Capitalcore Ltd”. This post has been published only for educational purposes.