- Posted By: capadmin
- Category: Market News
Interpreting EUR/USD’s Movement
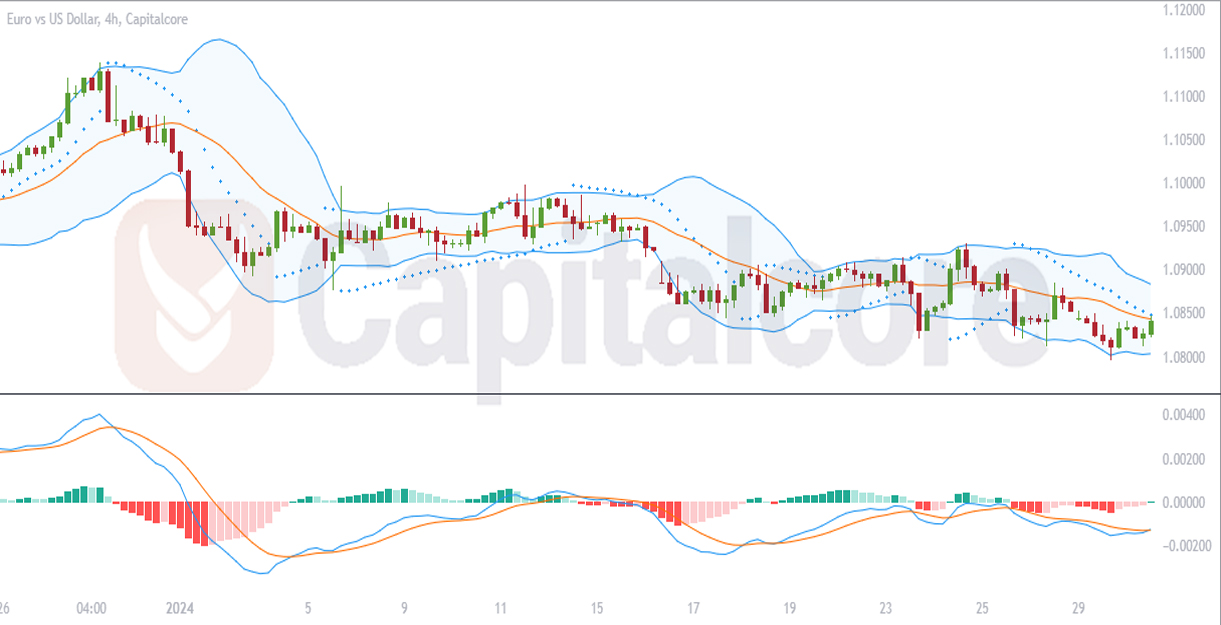
Analyzing the EUR/USD market on the H4 time frame, as shown in the uploaded chart, we see that a combination of technical indicators is utilized to assess the currency pair’s momentum and probable future trajectory. The Parabolic SAR, Bollinger Bands, and MACD are central in this analysis, each offering distinct perspectives on market behavior.

Chart Notes:
• Chart time-zone is UTC (+03:00)
• Candles’ time-frame is 4h.
The Parabolic SAR shows a dotted line above the price bars, traditionally indicating a bearish trend. This suggests that sellers are currently in control, and the downtrend may continue. The Bollinger Bands provide additional context; the price is tracking along the lower band, which typically signifies that the market is bearish. The bandwidth is not overly wide, which would imply that while the trend is bearish, volatility is not exceptionally high.
The MACD indicator, located below the price chart, illustrates that the MACD line (blue) is beneath the signal line (orange), reinforcing the bearish momentum signaled by the Parabolic SAR. Moreover, the MACD histogram bars are below the baseline, and while they show a slight increase in height, it indicates that the bearish momentum might be slowing, but not yet reversed.
In conclusion, the EUR/USD pair on the H4 chart is currently exhibiting a bearish trend, as indicated by both the Parabolic SAR and the Bollinger Bands. The MACD also supports this bearish outlook, although a potential slowdown in bearish momentum could be on the horizon. Traders should keep an eye on these indicators for signs of a momentum shift, such as the Parabolic SAR dots flipping below the price or the MACD line crossing above the signal line, which could suggest a change in trend direction.
• DISCLAIMER: Please note that the above analysis is not an investment suggestion by “Capitalcore Ltd”. This post has been published only for educational purposes.