- August 19, 2019
- Category: Market News
Bullish leg seems close
EUR has been acting weak against USD over the last week. On the price chart, the price line has had a sharp descend and after reaching a supply level, has had a smooth ascend. Different indicators have issued buy signal and overall look of the chart is bullish.
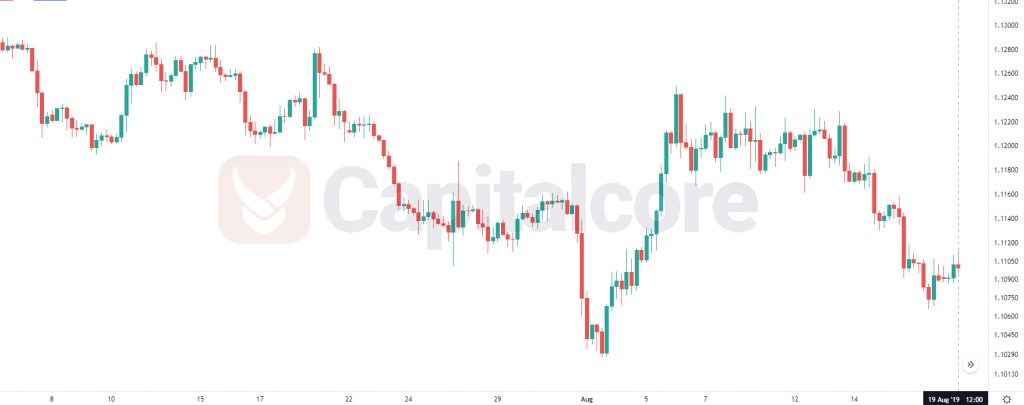
Chart Notes:
• Chart time-zone is UTC (+03:00)
• Candles’ time-frame is 4h.
The support rests at 1.10670 with resistance at 1.11130 which both lines are below the weekly pivot point at 1.11290. The EMA of 10 is moving with bearish bias in the descendant channel and it is below the EMA of 200 and the EMA of 100. The RSI is moving in oversold area, the Stochastic is moving in middle ranges and the MACD line is below the signal line in the negative territory. The ADX is not showing any clear signals.
The price decline may continue towards 1.10500 but later buyers can target the upper Bollinger band at 1.11700.
• DISCLAIMER: Please note that the above analysis is not an investment suggestion by “Capitalcore Ltd”. This post has been published only for educational purposes.