a descending wave is expected
Last week USD was under pressure due to US-China trade talks. On the chart the price line is ascending through a channel. The overall look of the chart is descending and a strong resistance level is stopping the growth. A short ascending wave is expected to the base of the channel.
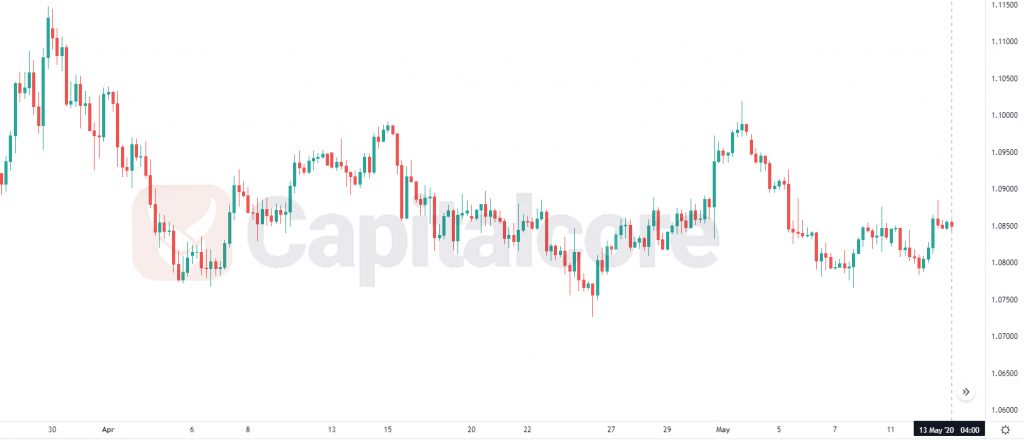
Chart Notes:
• Chart time-zone is UTC (+03:00)
• Candles’ time-frame is 4h.
The support rests at 1.12220 with resistance at 1.12440 which both lines are above the weekly pivot point at 1.12180. The EMA of 10 is moving with bullish bias in the ascendant channel and it is below the EMA 200 and above the EMA of 100. The RSI is falling towards 50 level and the Stochastic is showing downward momentum. The MACD line is above the signal line in the positive territory. The ADX is not showing any clear signals.
The price has already reached the upper Bollinger band; it will be dropping down towards 1.12030.
• DISCLAIMER: Please note that the above analysis is not an investment suggestion by “Capitalcore Ltd”. This post has been published only for educational purposes.