The price line is still inside the bearish channel
EUR/USD price started a downtrend in the beginning of June 2021; which resulted more than 21.7% dump on this pair’s chart. After few weeks, a bearish channel could be considered for this pair, the base line of this channel, like as the multiple times in the past, could once more stop the downtrend and the position of the price line on this pair is now quote eye-catching.
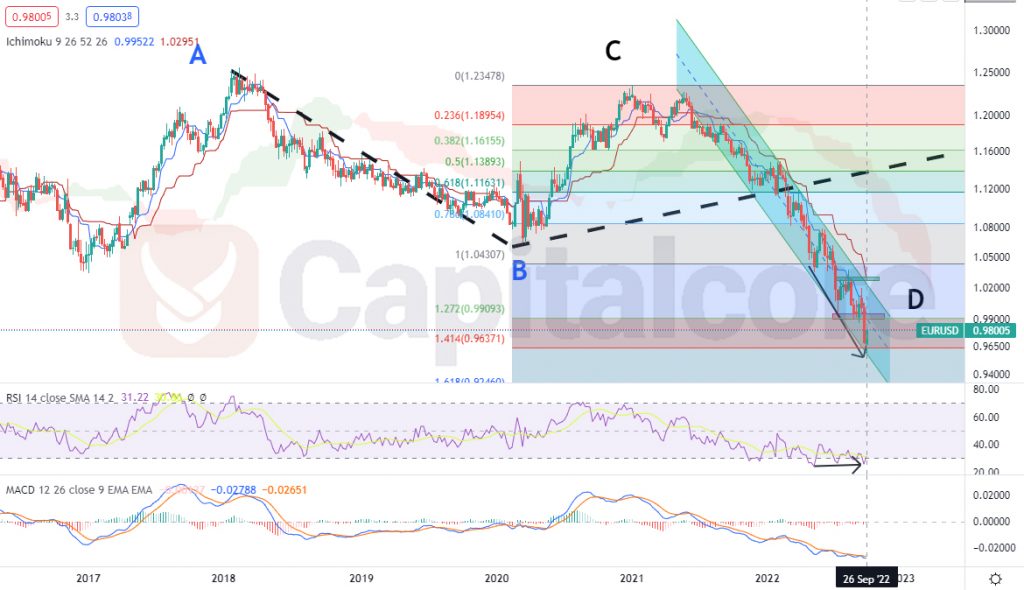
Chart Notes:
• Chart time-zone is UTC (+03:00)
• Candles’ time-frame is weekly.
The price line on EUR/USD price chart, froze on 0.98005 after the Forex market was closed for the weekend. We contemplated a bearish channel, indicated as a descending blue zone, for the bearish trend on this pair; also, we injected a Fibonacci retracement from A/B wave, onto C/D wave, the Fibonacci levels on the chart, reflects the results we got. As you can see on the chart, the price line once more reacted to the bottom line of the descending channel, issuing a positive divergence comparing to the RSI indicator, which has been revealed, using two black arrows. on the chart. Level 1.414 of the Fibonacci retracement also is located just below the price line, which would empower the chance of supporting the price on this area. In the up-coming week, traders can expect a slightly bullish wave, and bulls would have a higher chance of winning. Also consider that in case the price line falls below 0.95350, bears would be expected to take back the power.
• DISCLAIMER: Please note that the above analysis is not an investment suggestion by “Capitalcore Ltd”. This post has been published only for educational purposes.