Analyzing EURUSD Market Sentiment Ahead of Key Economic Data
The EUR/USD forex pair, often nicknamed “Fiber,” represents the exchange rate between the Euro and the US Dollar. Today, the market is particularly attentive to several significant US economic data releases, including Average Hourly Earnings, Non-Farm Employment Change, and the Unemployment Rate, which are high-impact events likely to influence USD volatility. Additionally, low-impact data from Germany and France, alongside speeches from key financial figures, could also affect market sentiment.
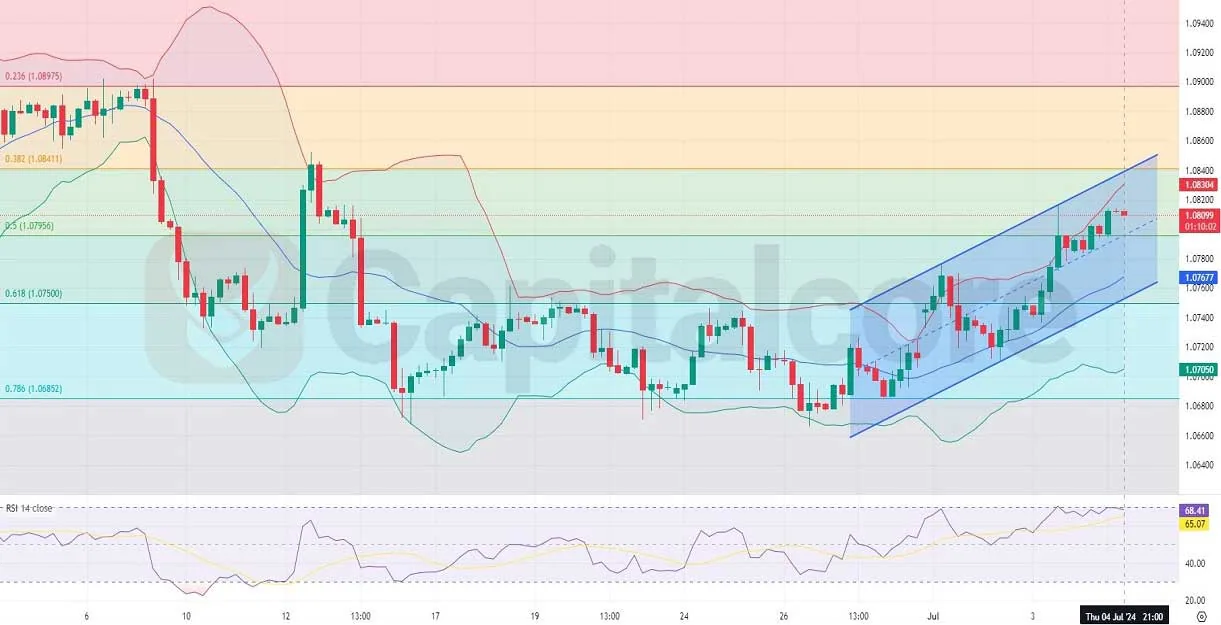
Chart Notes:
• Chart time-zone is UTC (+03:00)
• Candles’ time-frame is 4h.
In the H4 chart of EUR USD, the price has been trending positively, moving within the upper half of the Bollinger Bands and frequently touching the upper band. Among the last 16 candles, six have been bearish, including the most recent two, yet the overall EUR-USD trend remains upward. The widening Bollinger Bands suggest increasing volatility, while the RSI indicates that the market is nearing overbought conditions. The price movements align with key Fibonacci retracement levels, with resistance around the 0.382 and support around the 0.618 levels, suggesting potential areas for future price action.
• DISCLAIMER: Please note that the above analysis is not an investment suggestion by “Capitalcore Ltd”. This post has been published only for educational purposes.