EUR/USD H4 Downtrend Continues with Bearish Momentum
The EUR/USD forex pair, often referred to as “Fiber,” is one of the most actively traded currency pairs in the forex market, representing the economies of the European Union and the United States. Its liquidity and volatility make it a favorite among traders, especially during times of major economic releases from either region. Today, key European and US data, such as the Eurozone Wholesale Price Index and the US Producer Price Index (PPI), will be the focal points, offering insights into inflationary pressures in both economies. Higher-than-expected PPI or Wholesale Price Index results could signal potential price increases passed on to consumers, impacting inflation and potentially affecting ECB or Fed rate decisions.
Fundamentally, the euro currency may see significant movement today, driven by the Wholesale Price Index (WPI) in the Eurozone and unemployment data from Istat, both of which indicate the broader economic health. Rising wholesale prices could further strain inflationary pressures, making the ECB’s monetary policy increasingly important. On the US side, PPI data is crucial as it could signal inflationary changes, prompting traders to look for clues about the Fed’s future rate hikes. With the recent ECB decisions on rates and the looming US data, volatility is expected, especially if the data deviates significantly from forecasts.
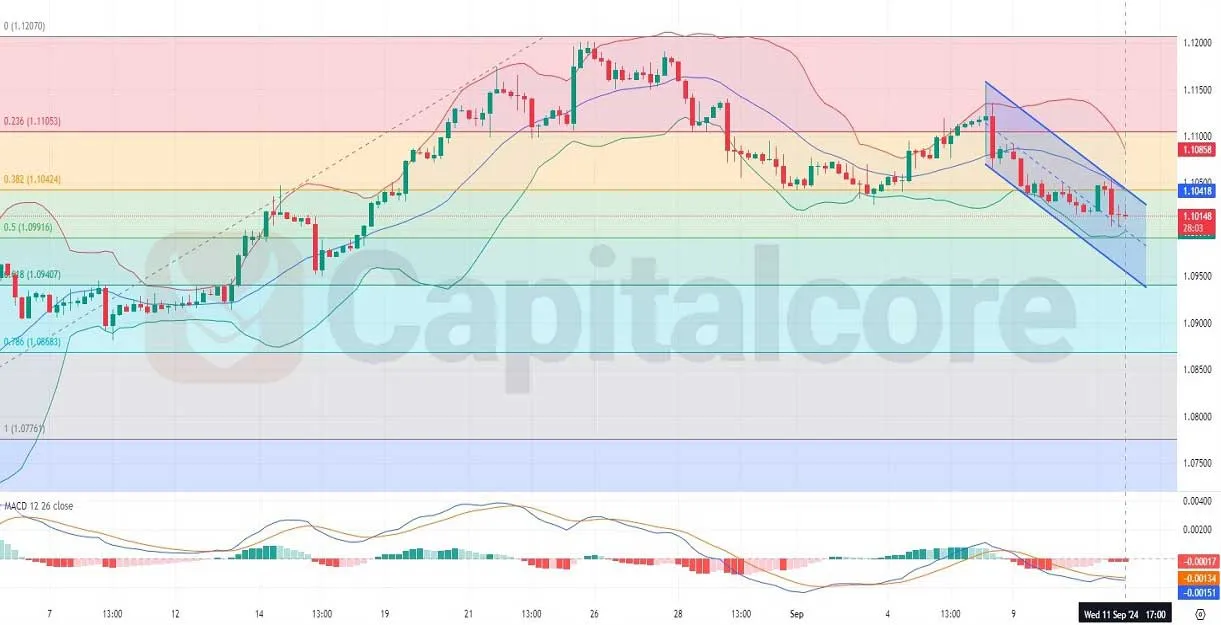
Chart Notes:
• Chart time-zone is UTC (+03:00)
• Candles’ time-frame is 4h.
The EUR/USD H4 chart displays a clear downtrend, as the price has been consistently bearish over the past four candles. It has descended from the upper Bollinger Band and is now hovering between the middle and lower bands, indicating increasing bearish pressure. The Bollinger Bands have widened slightly, suggesting potential for further price movement, with volatility picking up. The Fibonacci retracement levels show that the price is fluctuating between the 0.382 and 0.5 levels, highlighting a potential support area near the 1.09116 level. However, the MACD indicator shows bearish momentum, as the histogram bars are increasing in the negative region, signaling that the price could continue its downward movement.
As the Fiber price approaches the lower bands and key Fibonacci levels, traders should watch for a break below the 1.09116 level, which could trigger further selling pressure. However, a reversal near the middle Bollinger Band could suggest consolidation or potential bullish recovery if it holds support at the 0.5 Fibonacci level.
• DISCLAIMER: Please note that the above analysis is not an investment suggestion by “Capitalcore LLC”. This post has been published only for educational purposes.