Bears eyes, on EUR/USD chart
EUR is moving slowly against USD which is empowered by the US nonfarm payrolls in June. On the chart the price is reducing through a bearish channel. After a huge dump that started several days ago, a small bullish step is expected and then the descend would continue. The overall look of the chart is bearish
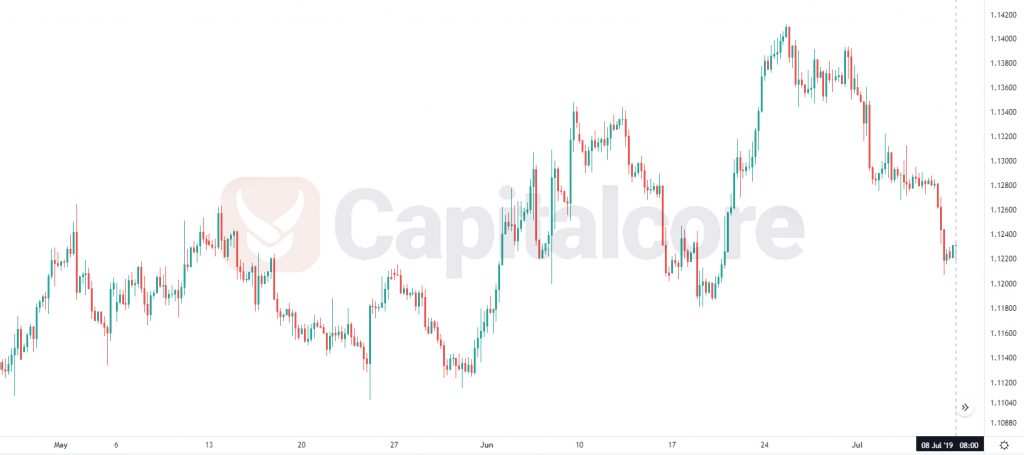
Chart Notes:
• Chart time-zone is UTC (+03:00)
• Candles’ time-frame is 4h.
The support rests at 1.12140 with resistance at 1.12440 which both lines are below the weekly pivot point at 1.12680. The EMA of 10 is moving with bearish bias in the descendant channel and it is above the EMA of 200 and the EMA of 100. The RSI is moving in oversold area, the Stochastic is moving in low ranges and the MACD line is below the signal line in the negative territory. The ADX is showing sell signal.
While the bearish trend remains, EURUSD may grow towards the middle Bollinger band at 1.12680 but then sellers can return to the market again.
• DISCLAIMER: Please note that the above analysis is not an investment suggestion by “Capitalcore Ltd”. This post has been published only for educational purposes.