- December 2, 2019
- Category: Market News
The price is at the top of descending channel and buy signals are issued!
EUR is trying to recover from the previous loss against USD. Its first attempt was not successful and now the price is trying to break out of the trendline once more; this time indicators are issuing bullish signals and there is a support level pretty close to the current position of the price. Generally saying, EUR is more lucky to recover against USD this time.
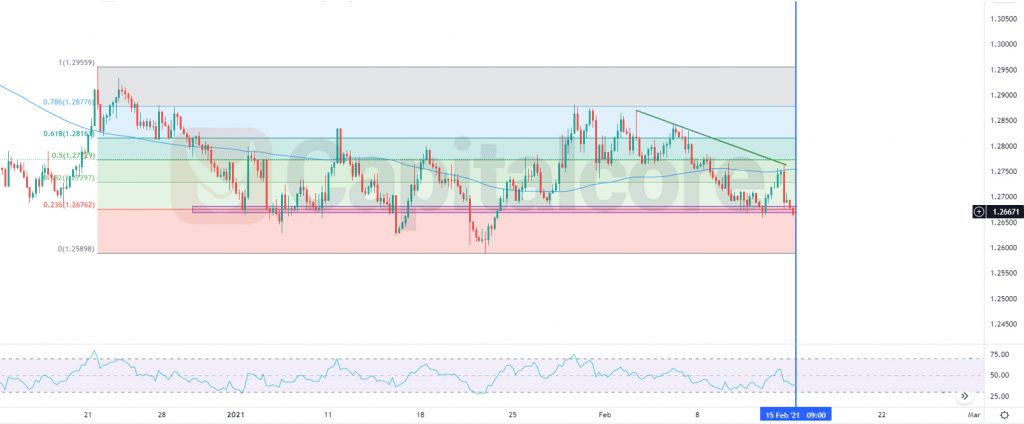
Chart Notes:
• Chart time-zone is UTC (+03:00)
• Candles’ time-frame is 4h.
The support rests at 1.10010 with resistance at 1.10320 which the weekly pivot point at 1.10100 is located in between the lines. The EMA of 10 is moving with bullish bias in the descendant channel and it is below the EMA of 200 and the EMA of 100. The RSI is moving on 50 level, the Stochastic is moving in high ranges and the MACD line is above the signal line in the positive territory. The ADX is showing buy signal.
Considering the correction pattern, EURUSD may be growing towards 61.8 level of Fibonacci at 1.10500.
• DISCLAIMER: Please note that the above analysis is not an investment suggestion by “Capitalcore Ltd”. This post has been published only for educational purposes.