Head and shoulders pattern is formed
The US stock market and the oil prices have fallen. EURUSD will be chiefly under the influence of the reports from Germany. On the chart, the price has been through a sharp zig-zag move and currently as it seems, another descending wave is about to occur.
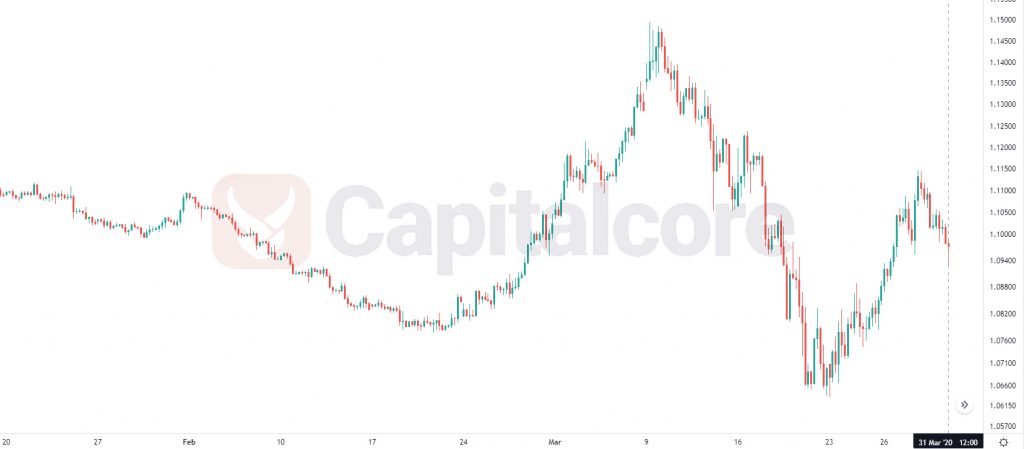
Chart Notes:
• Chart time-zone is UTC (+03:00)
• Candles’ time-frame is 4h.
The support rests at 1.10280 with resistance at 1.11900 which both lines are above the weekly pivot point at 1.09760. The EMA of 10 is moving with bullish bias in the ascendant channel and it is above the EMA of 200 and the EMA of 100. The RSI is moving above 50 level, the Stochastic is showing downward momentum and the MACD line is above the signal line in the positive territory. The ADX is showing buy signal.
The bullish trend is limited to the resistance line. EURUSD may start its decline towards the middle Bollinger band at 1.09700.
• DISCLAIMER: Please note that the above analysis is not an investment suggestion by “Capitalcore Ltd”. This post has been published only for educational purposes.