Should we be waiting for a big growth?
The NY Empire State manufacturing index and the nation’s producer price index data have increased. The price is forming an ascending trend. Indicators have not issued any buy or sell signals. The overall look of the chart is bullish but more details is needed to open any trade.
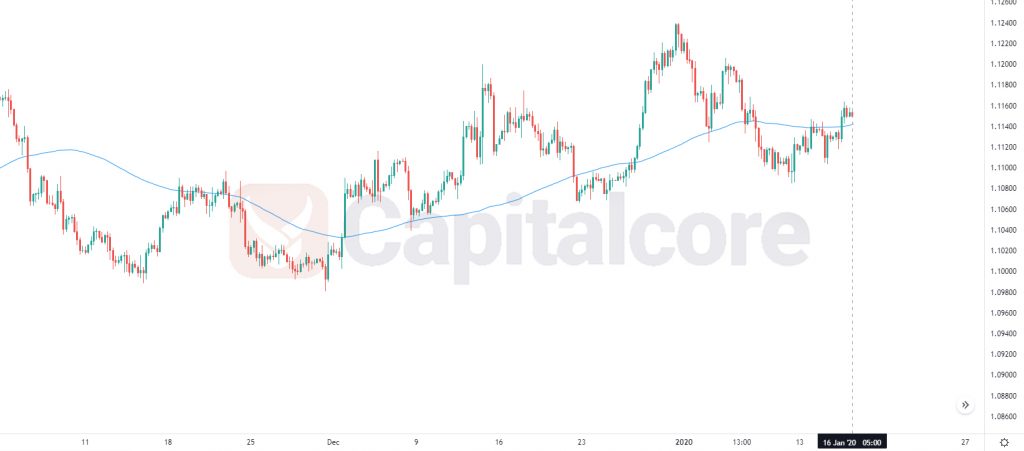
Chart Notes:
• Chart time-zone is UTC (+03:00)
• Candles’ time-frame is 4h.
The support rests at 1.11250 with resistance at 1.11580 which the weekly pivot point at 1.11370 is located in between the lines. The EMA of 10 is moving with bullish bias in the ascendant channel and it is above the EMA of 100 and above the EMA of 200. The RSI is moving on 50 level, the Stochastic is moving in high ranges and the MACD line is above the signal line in the positive territory. The ADX is showing sell signal.
The price has already reached 61.8 level of Fibonacci completing the correction pattern however the resistance level breakout will confirm further price growth towards 1.11750.
• DISCLAIMER: Please note that the above analysis is not an investment suggestion by “Capitalcore Ltd”. This post has been published only for educational purposes.