The support level looks too fragile to hold the price
EUR was empowered due to the growth of consumer climate index in Germany. On EUR/USD price chart. the price is on a very strong resistance level. The level is not expected to be penetrated as it has dumped the price several times in the past few days. Some indicators are showing weak buy signals; the chart, however, looks to be bearish in the next few days.
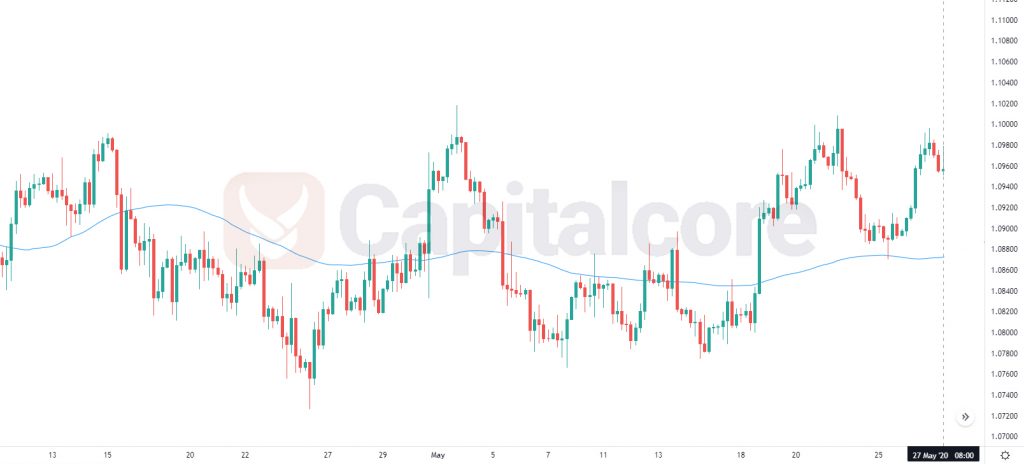
Chart Notes:
• Chart time-zone is UTC (+03:00)
• Candles’ time-frame is 4h.
The support rests at 1.09270 with resistance at 1.09900 which both lines are above the weekly pivot point at 1.09040. The EMA of 10 is moving with bullish bias in the ascendant channel and it is above the EMA of 200 and the EMA of 100. The RSI is moving on 50 level, the Stochastic is showing downward momentum and the MACD line is above the signal line in the positive territory. The ADX is showing weak buy signal.
The resistance line is too strong to be broken. EURUSD will be fluctuating within the upper Bollinger band.
• DISCLAIMER: Please note that the above analysis is not an investment suggestion by “Capitalcore Ltd”. This post has been published only for educational purposes.