Bulls seem to be putting an end to the descending trend
EUR,USD started a bearish trend on 2nd of June 2021, after scoring a new climax at about 1.225. The descending wave caused the price on this pair to dump up to almost 18.8% in almost 14 months; and at the moment, it has reached to a strong resistance level.
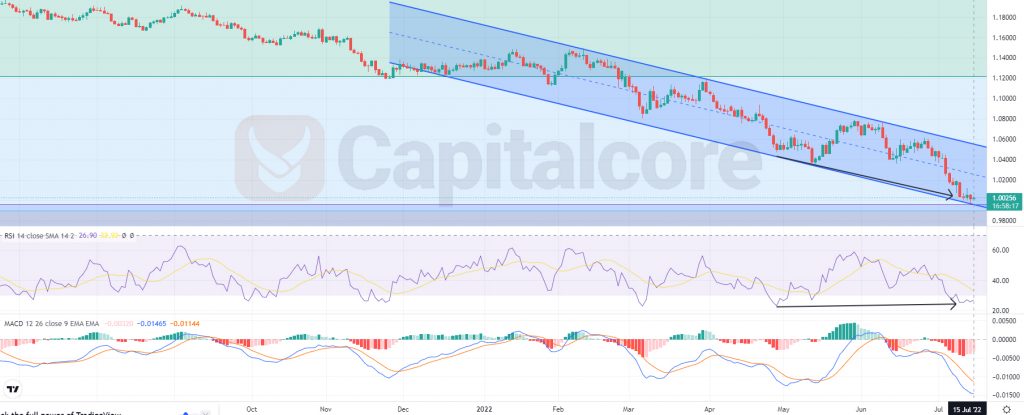
Chart Notes:
• Chart time-zone is UTC (+03:00)
• Candles’ time-frame is daily.
The price line on ERU/USD price chart is showing 1.00256 at this moment, this area is located just above a strong support zone at 1. The support zone is indicated as a dark box below the price line. The descending blue zone on the chart is reflecting the descending channel, which was formed through the current descending wave. As you can see on the chart, the price line is at the bottom of this channel at the moment. RSI is showing overselling in the market and has also issued positive divergence signal, indicated by the black arrows. MACD is showing weakness in the bearish wave and therefore, a trend reversal looks potential on the chart.
Traders can be waiting for the price line to touch 0.995 once more; there they can enter long positions. The target for bulls can be considered on 1.123 and 1.214 after that. Please note that the above analysis would be of value just as long as the price line has not broken below 0.96.
• DISCLAIMER: Please note that the above analysis is not an investment suggestion by “Capitalcore Ltd”. This post has been published only for educational purposes.