After a huge dump, its finally time to rise!
USD is under pressure against most major currencies including EUR. as we can see in the following chart, EUR/USD had a strong dump for a couple of days ago. The price right now is on a very strong support zone. Different buy signals are issued by different indicators. the whole chart is showing trend reversal signals. In the following more details are given.
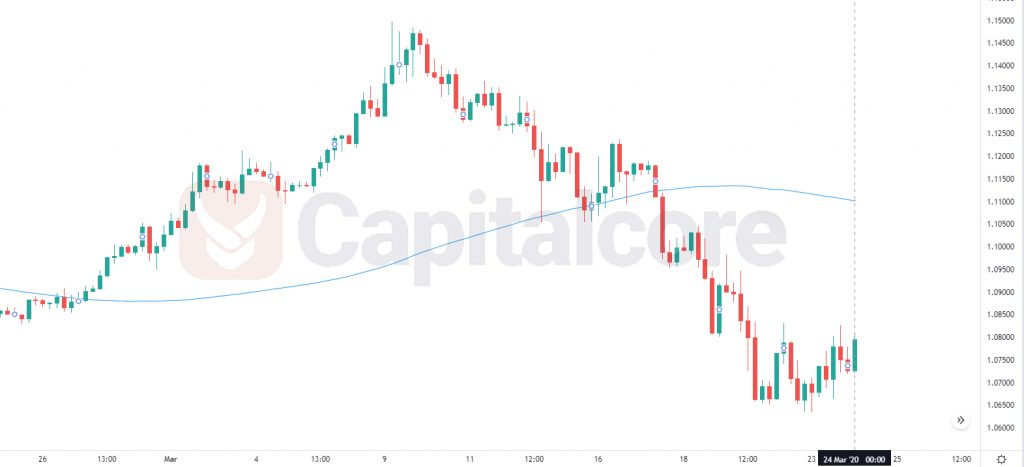
Chart Notes:
• Chart time-zone is UTC (+03:00)
• Candles’ time-frame is 4h.
The pair is finding support at 1.26370 with resistance at 1.26970 which the weekly pivot point at 1.27120 is located above the lines. The EMA of 10 is moving with bearish bias in the descendant channel and it is located below the EMA of 200 and the EMA of 100. The RSI is moving in oversold area, the MACD line is below the signal line in the negative territory and the Stochastic is moving in low ranges. The ADX is showing sell signal. The price is below the Ichimoku Cloud and the Chinkou Span. The Tenkan-sen and the Kijun-sen are both showing a downward trend.
Short positions are recommended towards 1.26200.
• DISCLAIMER: Please note that the above analysis is not an investment suggestion by “Capitalcore Ltd”. This post has been published only for educational purposes.