The ascend is still on going
Germany’s jobless rate grew less than expected and retail sales increased 13.9%. On the chart, as it seems, the descending wave has finished. bulls are about to take control. Different indicators have issued trend reversal signals and bullish market can be expected.
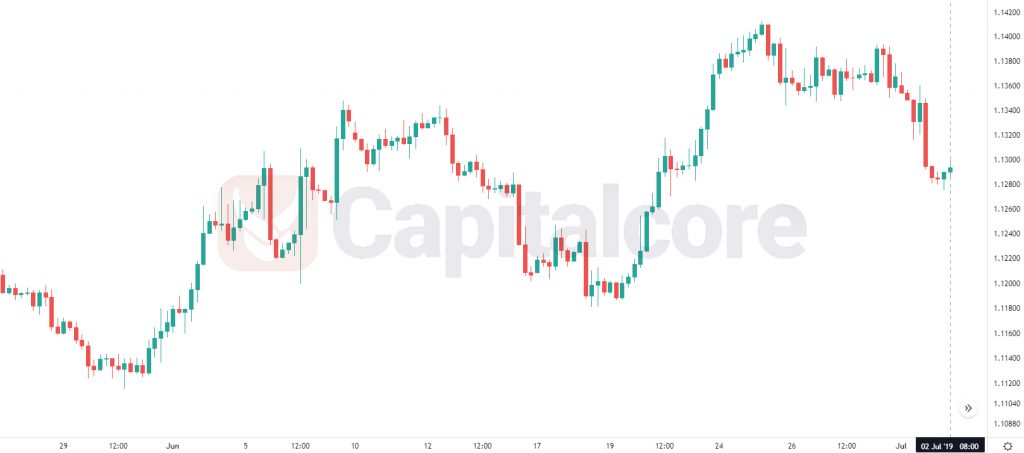
Chart Notes:
• Chart time-zone is UTC (+03:00)
• Candles’ time-frame is 4h.
The support rests at 1.12160 with resistance at 1.12880 which the weekly pivot point at 1.12330 is located in between the lines. The EMA of 10 is moving with bullish bias in the descendant channel and it is above the EMA of 200 and the EMA of 100. The RSI is moving above level 50, the Stochastic is moving in high ranges and the MACD line is above the signal line in the positive territory. The ADX is showing buy signal.
While EURUSD is moving in a tight range within the Bollinger bands, the resistance level breakout will pave the way for further growth towards 1.13000.
• DISCLAIMER: Please note that the above analysis is not an investment suggestion by “Capitalcore Ltd”. This post has been published only for educational purposes.