A bullish channel is being formed
There are no major economic reports in Eurozone but NAHB Housing Market Index will be released in the US. in the price chart the price line could finally break above the descending trendline and is currently forming a bullish channel.
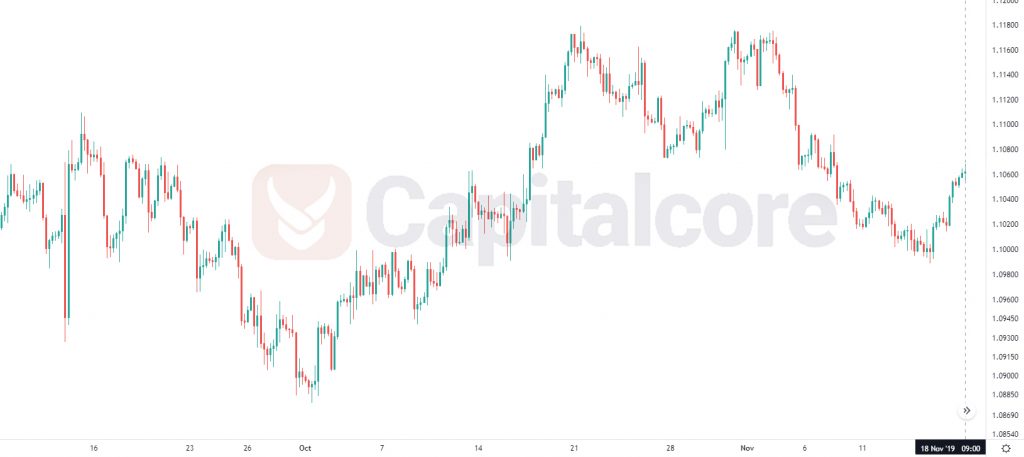
Chart Notes:
• Chart time-zone is UTC (+03:00)
• Candles’ time-frame is 4h.
The support rests at 1.10510 with resistance at 1.10720 which both lines are above the weekly pivot point at 1.10330. The EMA of 10 is moving with bullish bias in the ascendant channel and it is below the EMA of 200 and the EMA of 100. The RSI is moving in overbought area, the Stochastic is moving in high ranges and the MACD line is above the signal line in the positive territory. The ADX is showing buy signal.
EURUSD may continue its bullish trend towards 61.8 level of Fibonacci at 1.11100 slowly.
• DISCLAIMER: Please note that the above analysis is not an investment suggestion by “Capitalcore Ltd”. This post has been published only for educational purposes.