After a strong ascend and a rest, EUR/USD is ready for the next bullish step
ISM Non-Manufacturing Index grew in the US and European stocks and retail sales rose. Meanwhile EUR/USD chart broke our of descending trendline; this pair had a very powerful ascend a few weeks ago and now is potential to repeat it again. in the following you can find essential information if you are going to open a trade on this pair.
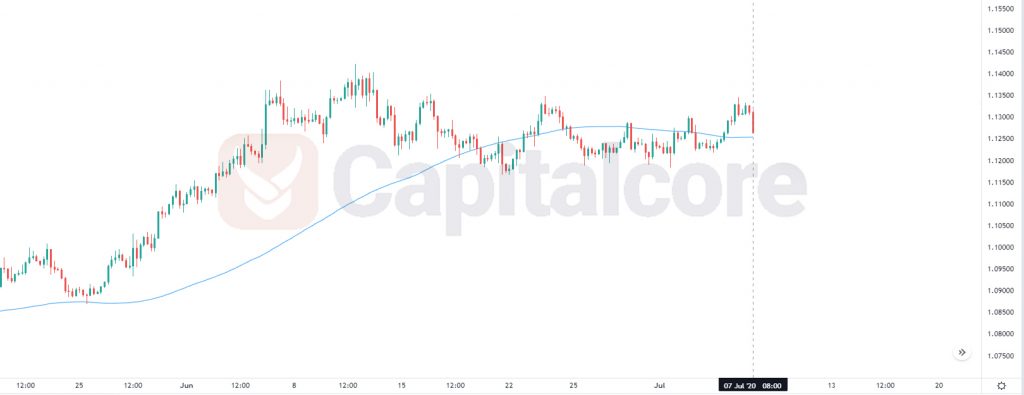
Chart Notes:
• Chart time-zone is UTC (+03:00)
• Candles’ time-frame is 4h.
The support rests at 1.12860 with resistance at 1.13640 which both lines are above the weekly pivot point at 1.12460. The EMA of 10 is moving with bullish bias in the horizontal channel and it is above the EMA of 200 and the EMA of 100. The RSI is moving in overbought area, the Stochastic is showing downward momentum and the MACD line is above the signal line in the positive territory. The ADX is showing buy signal.
EURUSD is growing towards 1.13700.
• DISCLAIMER: Please note that the above analysis is not an investment suggestion by “Capitalcore Ltd”. This post has been published only for educational purposes.