- February 25, 2019
- Category: Market News
Ascending channel has formed
Lack of economic data from Eurozone draws traders’ attentions to US Chicago Fed national activity index for January and the Dallas Fed manufacturing activity for February. On the chart, EUR is covering the previous lost against USD and the price is climbing up a channel.
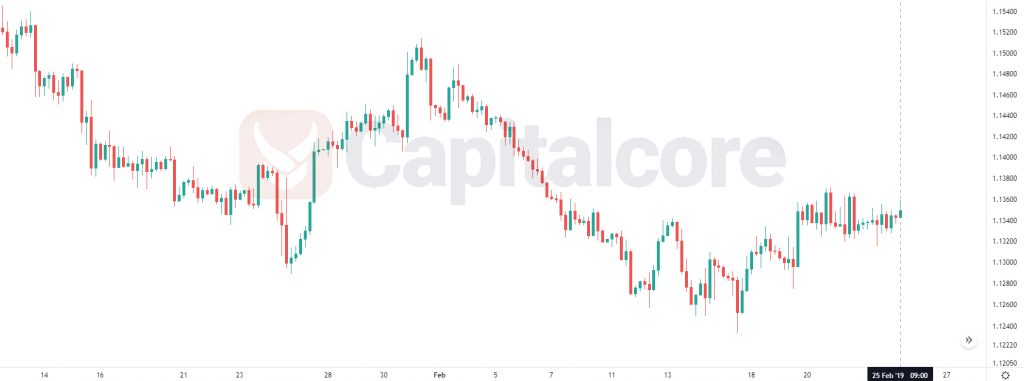
Chart Notes:
• Chart time-zone is UTC (+03:00)
• Candles’ time-frame is 4h.
The support rests at 1.13380 with resistance at 1.13600 which both lines are above the weekly pivot point at 1.13270. The EMA of 10 is moving horizontally in the ascendant channel and it is below the EMA 100 and the EMA of 200. The RSI is rising towards overbought area and the Stochastic is showing upward momentum. The MACD line is below the signal line in the negative territory. The ADX is showing buy signal.
The resistance level breakout will confirm the correction pattern towards 61.8 level of Fibonacci at 1.1405, otherwise EURUSD may decline towards 1.1300.
• DISCLAIMER: Please note that the above analysis is not an investment suggestion by “Capitalcore Ltd”. This post has been published only for educational purposes.