A strong resistance is on the way
Euro-zone’s gross domestic product jumped and trade surplus grew more than expected. The US retail sales grew less than forecasted. On the chart, the price line had had a strong descend and after touching the resistance at about 1.1875, side way market started. now the price line is once more approaching the resistance area.
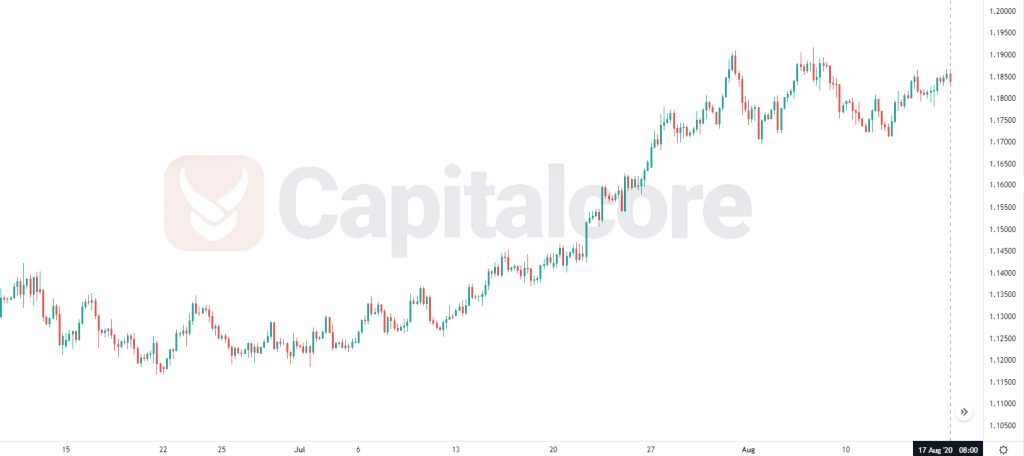
Chart Notes:
• Chart time-zone is UTC (+03:00)
• Candles’ time-frame is 4h.
The support rests at 1.18180 with resistance at 1.18750 which both lines are above the weekly pivot point at 1.18050. The EMA of 10 is moving with bullish bias in the horizontal channel and it is above the EMA of 200 and the EMA of 100. The RSI is moving on overbought area, the Stochastic is moving in high ranges and the MACD line is above the signal line in the positive territory. The ADX is showing buy signal.
EURUSD is moving in a tight range. The bullish pressure may push the price up towards the upper Bollinger band at 1.18800.
• DISCLAIMER: Please note that the above analysis is not an investment suggestion by “Capitalcore Ltd”. This post has been published only for educational purposes.