Trend reversal is expected
EUR/USD price line, started a descending wave on the beginning of June 2021 and descended about 11.7% until 7th of March 2022, when the price line reached out to a support level. The descending slope on the chart of this pair is currently reducing and a trend reversal might occur shortly.
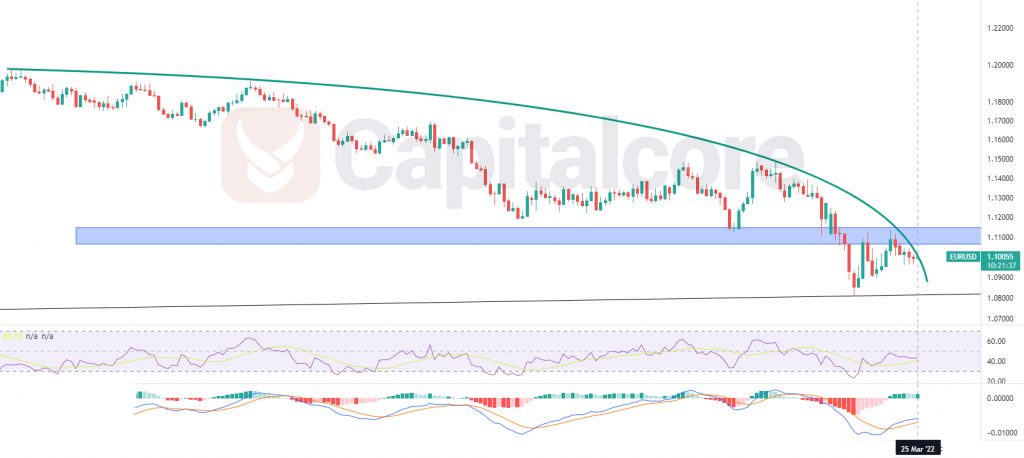
Chart Notes:
• Chart time-zone is UTC (+03:00)
• Candles’ time-frame is daily.
The price line is showing 1.10055 at the moment; this area lays between a broken static support level, which might have shifted to a resistance level since it was broken, and a dynamic support level which has not been broken yet; The dynamic resistance is shown as a black line on the chart, and the static level is shown as a blue zone. The green line on the chart suggests that the descending slope is increasing at a crazy range and this points out to the instant need of a correction phase. Traders can be waiting for the price to break above the static zone and on the retest of this zone, buyers can enter the market and target 1.156 and 1.19. Please note that this theory is valid as long as the price line has not broken below the black line on the chart, which would be the dynamic support level.
• DISCLAIMER: Please note that the above analysis is not an investment suggestion by “Capitalcore Ltd”. This post has been published only for educational purposes.