Bullish signals are being issued
EUR/USD price started a bearish wave on 6th of January 2021, and the price on this pair dumped up to 15% until 28th of April 2022, when it reached our to a strong weekly support. The price line then reacted to this area and is now potential of going through a trend reversal.
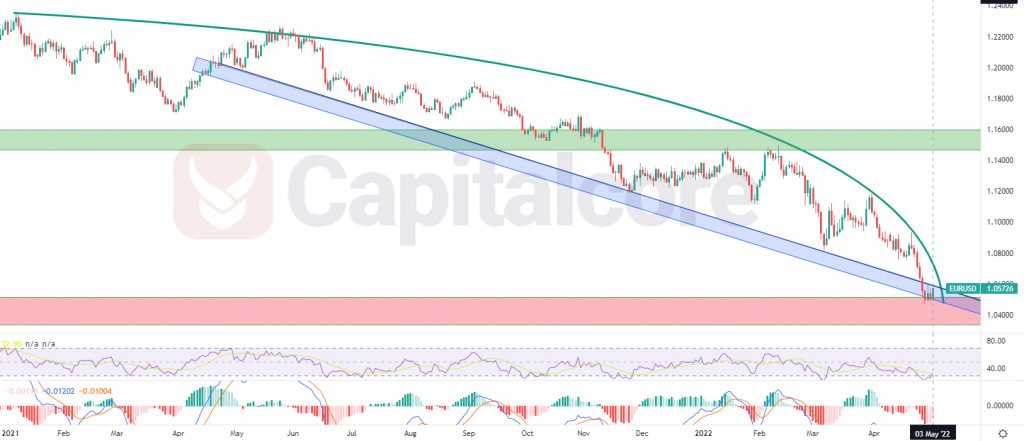
Chart Notes:
• Chart time-zone is UTC (+03:00)
• Candles’ time-frame is daily.
The price line at the moment is on 1.05726, Which would be just on the weekly support, which is shown as a red box below the price line. The green line above the price line indicates increasing bearish slope on the chart, which reflects over selling in the market; this is also visible on RSI, where the price line has entered over sold area. RSI is also issuing positive divergence and MACD is showing weakness in descending trend. Traders can be waiting for the price line to break out of the green line, and then they can set bullish orders on the red zone. The target for the ascending wave could be considered on on 1.145 and 1.19. Please consider that, in case the price line breaks below the red zone, before breaking out of the green line, the chance for an ascending wave would highly decrease.
• DISCLAIMER: Please note that the above analysis is not an investment suggestion by “Capitalcore Ltd”. This post has been published only for educational purposes.