A bullish leg can be expected
The price line on EUR/USD price chart has been moving within a bearish channel since late October. The price line is now approaching to a support zone and it seems as if the price line is about to go through a bullish leg shortly.
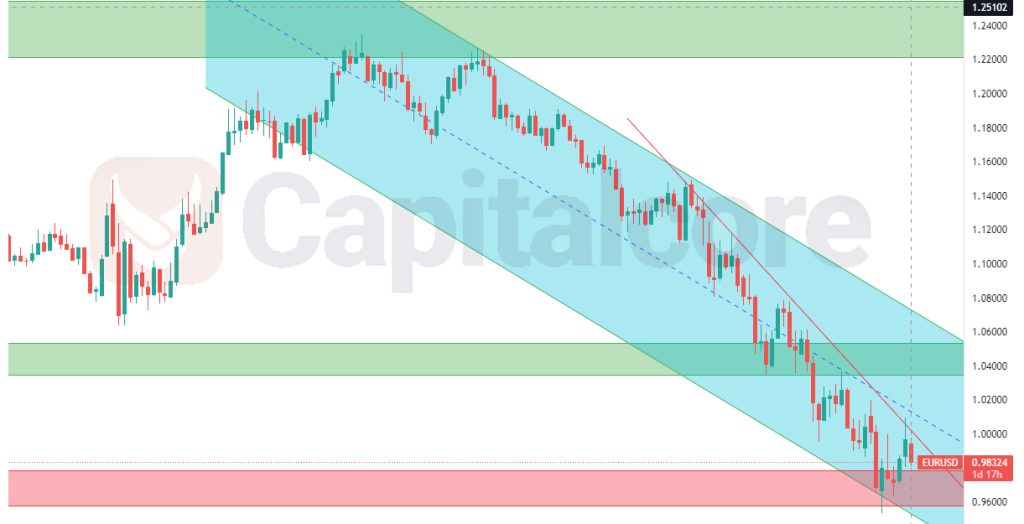
Chart Notes:
• Chart time-zone is UTC (+03:00)
• Candles’ time-frame is 4h.
The blue area on the chart indicates the mentioned bearish channel. The red zone on the chart reflects a strong support zone which is expected to pump the price once more, due to the previous reactions it has submitted. The descending thin red line on the chart, indicates the trend line, below which the last descending leg has occurred. Buyers can keep a keen eye on the chart to spot any ascending signals, breaking above the short term trend line as instance, then they can enter long position, the retest of the red zone. The target for them can be set on 1.05400 and 1.11555. In case the bulls generate enough ascending power, the resistance on 1.22000 could also be expected to be touched. Traders should also take into the consideration that breaking below 0.95000 would highly reduce the ascending chance.
• DISCLAIMER: Please note that the above analysis is not an investment suggestion by “Capitalcore Ltd”. This post has been published only for educational purposes.